Webjet Limited
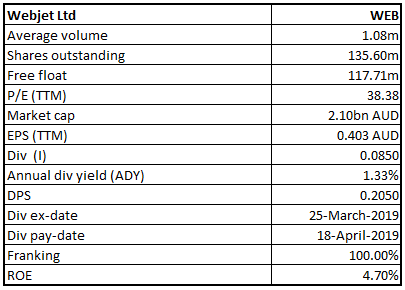
WEB Details
Strong Performance in 1HFY19:Webjet Limited (ASX: WEB) had lately reported that it will be paying ordinary dividend of AUD 0.085 to its shareholders, the record date of which shall be March 21, 2019 and payment date shall be April 18, 2019. Recently, the group has delivered a strong set of numbers in 1HFY19 and accounted 29% growth in Total Transaction Value (TTV) to $1,867 Mn as compared to the prior corresponding period.This progress was underpinned by a 2% surge in B2C and a 65% rise in B2B. As a result, Revenue grew by 33% to $175.3 Mn in 1HFY19 over the prior corresponding period. It also posted a 42% growth in EBITDA for the 1H19 which came in at $58.0 million. This growth was achieved predominantly on the back of the WebBeds B2B segments growth. WebBeds business was driven by strong growth seen in the key European and Middle East markets, with meaningful EBITDA delivered from the Americas.
What to Expect From WEB: The management has stuck on its guidance stating that it is on track to deliver an EBITDA (excluding one-offs which are associated with DOTW acquisition) for FY19 of at least $120 million.
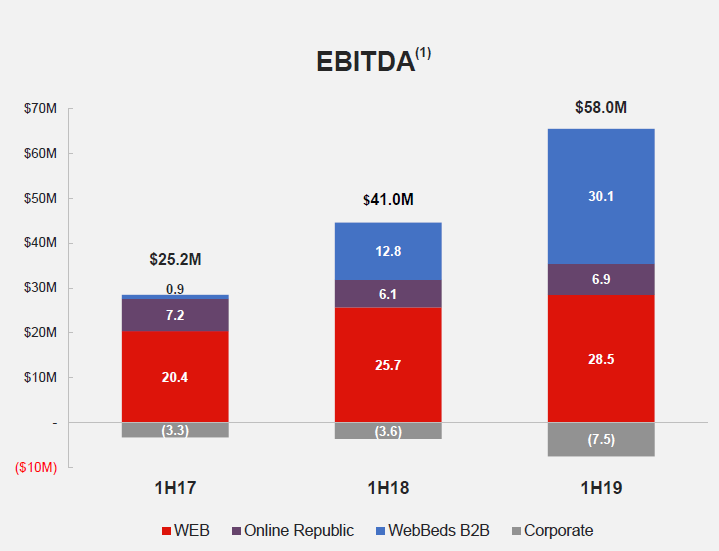
WEB’s EBITDA Growth trend (Source: Company Reports)
On the analysis front, the company is having an adjusted cash conversion for the 1HFY19 (Adjusted OCF/EBITDA) @ 95%, depicting improved working capital management & good quality earnings performance. Meanwhile, the stock price has risen 32.39% in the past one month (as at March 01, 2019) and is trading at higher PE multiple of 38.38x. We presume that at the current level, the price has discounted all the positive catalysts as it is trading slightly towards the higher level. Hence, we maintain our “Expensive” recommendation on the stock at the current market price of $15.92 per share (up 3.042% on March 04, 2019).
.png)
WEB Daily Chart (Source: Thomson Reuters)
BWX Limited
BWX Details
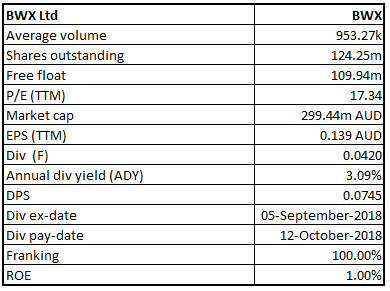
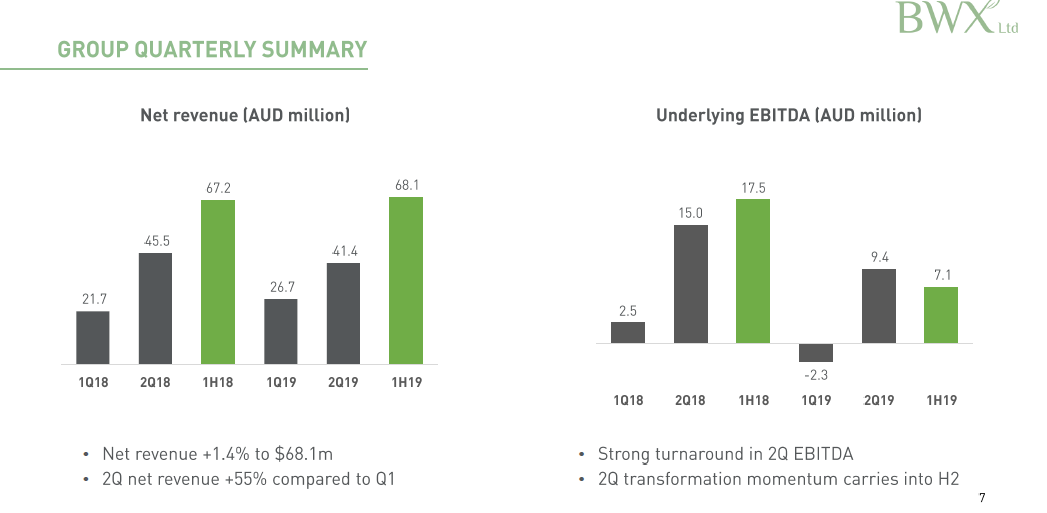
A Look At 1H FY 2019 Results:BWX Limited (ASX: BWX) had lately reported an underlying EBITDA of $7.1 million representing a fall of 59.5% on the pcp. The profit of the Group for the half-year after providing for income tax amounted to $2.6 million and witnessed a fall of 51.8% on pcp. The fall in profitability was due to the fact that the Group has faced challenges in the half-year, resulting from numerous disruptions incurred during the same period. The implementation of the new ERP system and failed management buy-out also affected the performance of the company, but a positive outlook remains from a strong second quarter.
What to Expect From BWX: The management has revised its guidance stating that it will deliver an EBITDA for FY19 ranging from $27-29 Mn as compared to the earlier stated $27-32 Mn. This tapering is on account of the postponement of the several upside initiatives originally planned for 1H FY 2019.
BWX key financial metrics (Source: Company Reports)
From the analysis standpoint, the current ratio stood at 1.71x in 1HFY19 with a nominal debt-to-equity ratio of 0.19x, showing decent liquidity of the firm to meet its obligation in the short run. Moreover, the company is trading at an EV/EBITDA multiple of 11.1x vis-a-vis the industry median of 9.8x. Moreover, the company has a P/BV of 1.1% which is decent enough & better than the Industry median of 1.8x. Hence, these parameters depict that the company is undervalued in terms of EBITDA and the P/BV that it generates. Meanwhile, the share price has fallen 29.74% in the past three months as of March 01, 2019 and is trading close to a 52-week lower level of $1.345. Hence, the stock seems to be trading at attractive prices and looking attractive for accumulation. Therefore, we recommend a “Speculative Buy” recommendation on the stock at the current market price of $2.400 per share (down 0.415% on March 04, 2019).
.png)
BWX Daily Chart (Source: Thomson Reuters)
Appen Limited
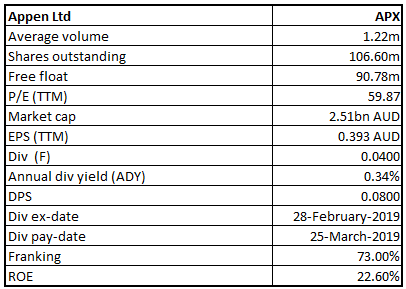
APX Details
Robust growth in content driven space: Appen Limited (ASX: APX), for the FY2018, reported that its Revenue increased by 119% to $364.3M. This growth was predominantly driven by the Content Relevance division, which witnessed a 148% increase in revenue over the prior year. The revenue growth of content relevance division was driven by existing and new customer investments in AI.
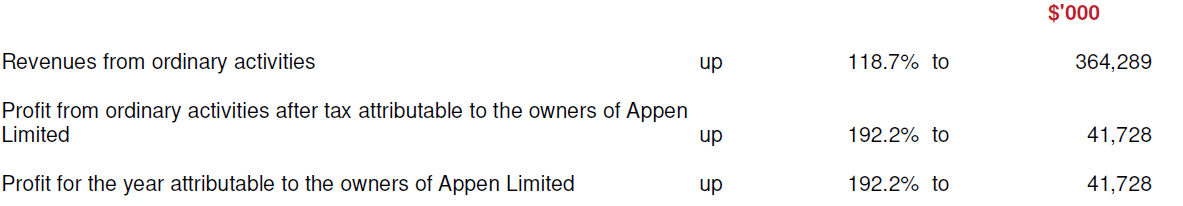
FY 2018 Highlights (Source: Company Reports)
The underlying EBITDA grew from $28.1M to $71.3M, a growth of 153%. This Growth resulted from the accelerating AI market and the strong demand for high quality training data. The Board of Directors declared a final dividend of 4 cents per share (franked to 73%) for the year ended December 31, 2018 which would be paid out of the profits reserve on March 25, 2019.
What to Expect from APX: As regards the outlook, the management continues to be optimistic about the ongoing growth potential in the broader AI space, and consequently for the company. In addition to its established positions in the technology, automotive and government sectors, there are attractive opportunities in the medium term for machine learning applications in financial services and industrials. At the end of December 2018, Appen Limited had net margins of 11.5% which is in line with the industry median of 11.5%.
Meanwhile, the share price of the company has risen 64.80% in the past three months (as at March 01, 2019) and is trading towards the higher level. Hence, we give an “Expensive” recommendation on the stock at the current market price of $24.05, considering aforesaid facts and current trading level.
.png)
APX Daily Chart (Source: Thomson Reuters)
Domain Holdings Australia Limited
DHG Details
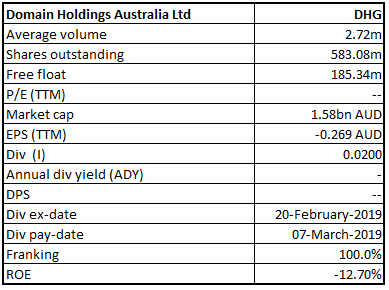
Marginal Rise in Total Revenues: Domains Holdings Australia Limited (ASX: DHG) has declared an ordinary fully paid dividend of AUD 0.02, the record date for which has been determined to be February 21, 2019 and the payment date shall be March 7, 2019. The company’s total revenues saw a growth of 0.3% to come in at $183.9 million. This marginal growth was on the back of an increase in Residential revenue by 8.6% and agent service revenue which rose by 15.2%.This was partially offset by the fall of 10.1% in the Media, Developers & Commercial revenue.
What to Expect From DHG: As regards the outlook, for FY19, Domain’s underlying costs (excluding investment in new Consumer Solutions businesses) are expected to be slightly down against proforma FY18. Total costs are expected to increase mid-single digit against proforma FY18. The continued investment in growth initiatives is anticipated to be well supported by ongoing cost discipline initiatives.
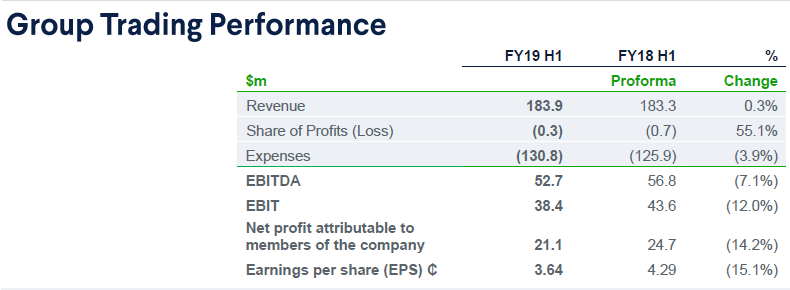
1HFY19 performance (Source: Company Reports)
On the financial parameter front, the company is trading at an EV/sales multiple of 4.8x vis-a-vis the industry median (Software & IT Services) of 4.2x. Hence, on that basis, it can be said that the company is trading at a premium level. Meanwhile, the share price has fallen 24.30% in the past six months as at March 01, 2019 and is trading close to a 52-week lower level of $2.06. Considering the premium valuations and current trading level, we have a wait and watch stance on the stock at the current market price of $2.670 per share (down 1.476% on March 04, 2019).
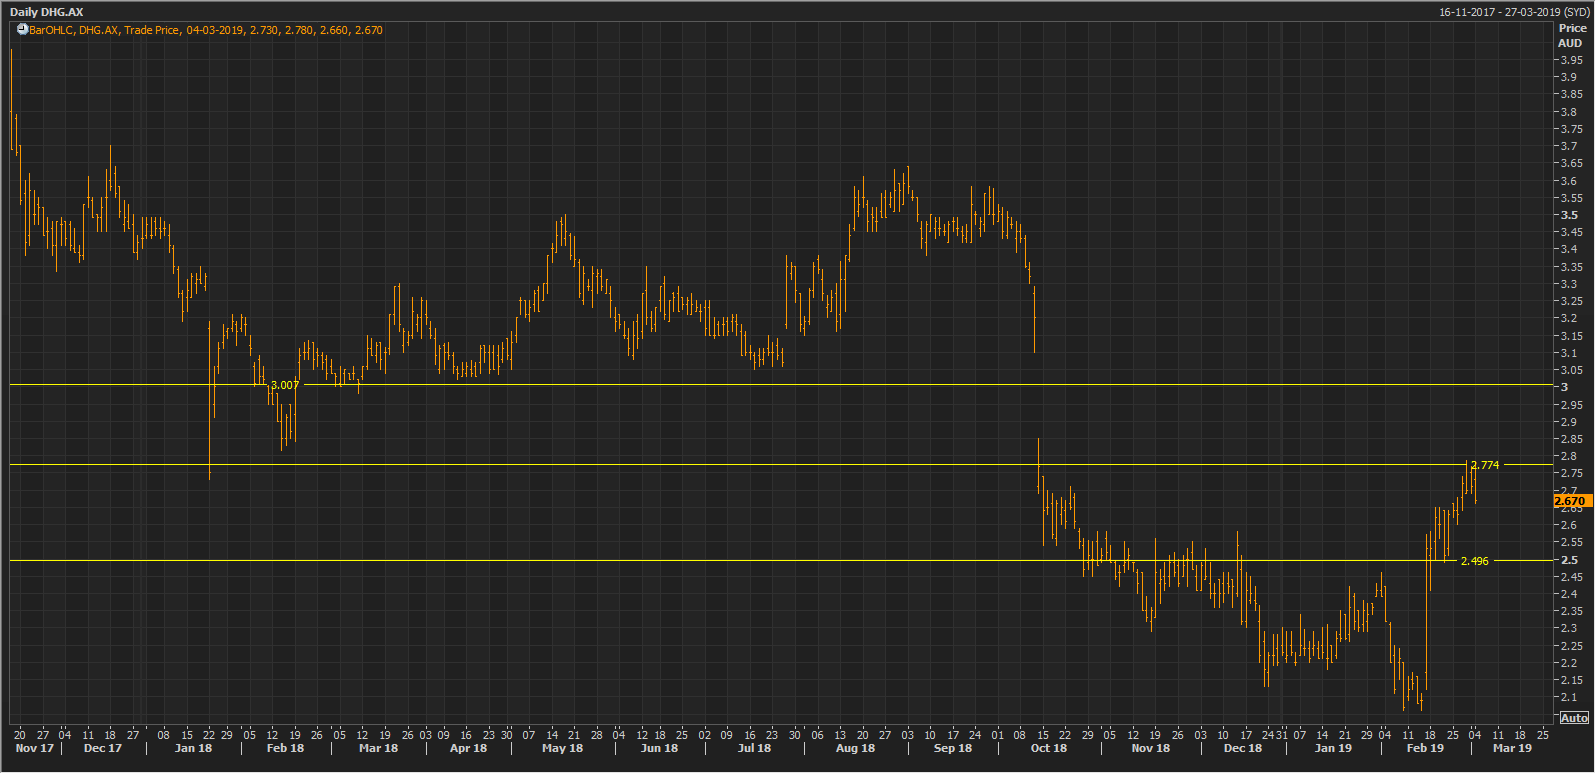
DHG Daily Chart (Source: Thomson Reuters)
Disclaimer
The advice given by Kalkine Pty Ltd and provided on this website is general information only and it does not take into account your investment objectives, financial situation or needs. You should therefore consider whether the advice is appropriate to your investment objectives, financial situation and needs before acting upon it. You should seek advice from a financial adviser, stockbroker or other professional (including taxation and legal advice) as necessary before acting on any advice. Not all investments are appropriate for all people. Kalkine.com.au and associated pages are published by Kalkine Pty Ltd ABN 34 154 808 312 (Australian Financial Services License Number 425376). The information on this website has been prepared from a wide variety of sources, which Kalkine Pty Ltd, to the best of its knowledge and belief, considers accurate. You should make your own enquiries about any investments and we strongly suggest you seek advice before acting upon any recommendation. Kalkine Pty Ltd has made every effort to ensure the reliability of information contained in its newsletters and websites. All information represents our views at the date of publication and may change without notice. To the extent permitted by law, Kalkine Pty Ltd excludes all liability for any loss or damage arising from the use of this website and any information published (including any indirect or consequential loss, any data loss or data corruption). If the law prohibits this exclusion, Kalkine Pty Ltd hereby limits its liability, to the extent permitted by law to the resupply of services. There may be a product disclosure statement or other offer document for the securities and financial products we write about in Kalkine Reports. You should obtain a copy of the product disclosure statement or offer document before making any decision about whether to acquire the security or product. The link to our Terms & Conditions has been provided please go through them and also have a read of the Financial Services Guide. On the date of publishing this report (mentioned on the website), employees and/or associates of Kalkine Pty Ltd do not hold positions in any of the stocks covered on the website. These stocks can change any time and readers of the reports should not consider these stocks as advice or recommendations.
 AU
AU

 Please wait processing your request...