.png)
Stocks’ Details
The Trade Desk, Inc.
TTD Partners ZALORA: The Trade Desk, Inc.(NASDAQ: TTD) provides a technology-based platform for advertising. The company is headquartered in Ventura, California, and carries on business mainly in the United States, Europe, and Asia. Recently, the company stated that it has consented to work in partnership with ZALORA on attribution integration to bring new measurement capabilities across Asia. With this collaboration, Trade Desk will be able to gain lots of possibilities for its customers and brand partners.
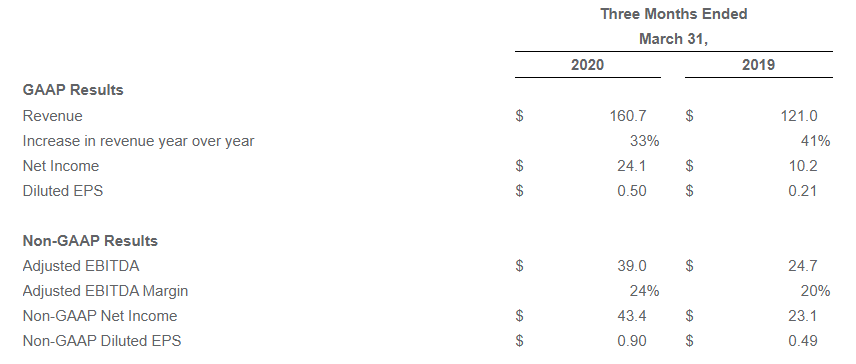
1QFY20 Key Financial Highlights: During the quarter, the company reported adjusted earnings of $0.90 per share, as compared with $0.49 per share reported in the year-ago period. During the quarter, the company reported revenues of $160.7 million as compared to $121 million reported in the year-ago quarter, driven by continued strength in programmatic ad buying. Also, TTD witnessed strong growth in its audio, video, Connected TV (CTV) and mobile in-app channels, during the quarter. Customer retention remained more than 95% in 1QFY20, in-line with the last 5 years. In 1QFY20, general and administrative (G&A) expenses increased 14.8% year over year and came in at $38.6 million. Adjusted EBITDA stood at $39 million, up from $24.7 million reported in the year-ago period. The company exited the period with a cash balance of $325.2 million, with net debt amounting to $143 million. Cash flow from operating activities during the quarter came in at $52.7 million.
Key Financial Highlights (Source: Company Report)
Key Risks:The company inked a partnership deal with TikTok, to allow advertisers to directly access premium TikTok inventory across the Asia-Pacific region via The Trade Desk platform. Due to the impact of Covid-19 on economic activity and advertiser demand, the company did not provide an outlook for 2QFY20. Further, it also suspended its guidance for FY20. It is worth noting that higher operating expenses, particularly selling & marketing, are expected to keep margins under pressure. Further, high debt and stiff competition represent another risk factor.
Valuation Methodology: P/BV Multiple Based Relative Valuation (Illustrative)
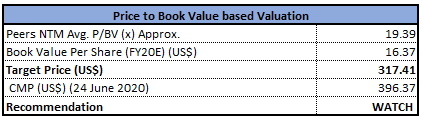
P/BV Multiple Based Relative Valuation (Source: Refinitiv, Thomson Reuters)
Note: All the forecasted figures are taken from Thomson Reuters, NTM: Next Twelve Months
Stock Recommendation: The stock of TTD closed at $396.37 with a market capitalization of ~$18.3 billion. The stock made a 52-week low and high of $136 and $421.06, respectively, and is currently trading at the upper band of its 52-week trading range. The stock went up by 33.3% and 132.09% in the last one month and three months, respectively. We have valued the stock using the P/BV multiple based illustrative relative valuation method and arrived at a target price with the correction of low double-digit (in percentage terms). Thus, it can be said that the stock of TTD is overvalued at current trading levels. Hence, considering the current trading levels and valuation, we have a watch stance on the stock at the current market price of $396.37, down 3.3% as on 24 June 2020.
DocuSign, Inc.
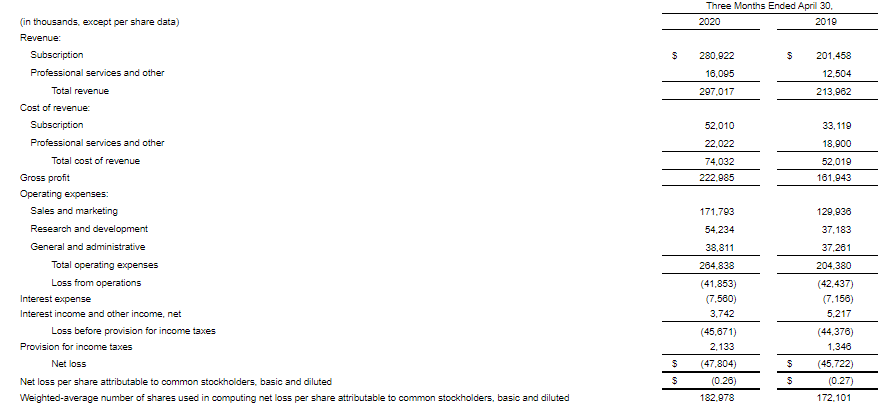
A Look at DOCU’s 1QFY21 Key Results: DocuSign, Inc. (NASDAQ: DOCU) is engaged in offering e-signature solutions to mortgage, non-profit, government, insurance, real estate, healthcare & technology industries. During the first quarter of fiscal 2021, the company reported total revenue of $297 million, which soared 39% from the prior corresponding period. The year over year increase was primarily due to higher subscription revenue which went up 39% year-over-year and professional services and other revenue, which increased 29% on pcp. The company’s total billing during the first quarter increased 59% and came in at $342.1 million.Non-GAAP gross margin during the period stood at 79%, flat on year over year.Non-GAAP net income came in at 12 cents per share, up from 7 cents reported in the year-ago period. Net cash provided by operating activities came in at $59.1 million, with free cash flow amounting to $32.8 million in 1QFY21. The company exited the period with a cash balance of $898.3 million.
Key Financial Highlights (Source: Company Report)
What to Expect: For 2QFY21, the company expects revenues to be in the range of $316 million and $320 million, whereas subscription revenues are projected to be in the band of $298 million and $302 million. DOCU expects non-GAAP gross margins to be in the ambit of 78% to 80%. For FY21, the company expects revenues to be in the range of $1,313 million and $1,317 million, whereas subscription revenues are expected to be between $1,243 million and $1,247 million. Non-GAAP gross margin is expected to be in the ambit of 78% to 80%.
Key Risks: Higher subscription sales to new and existing customers, enhanced engagement of professional services to boost the growing customer base, and synergies from the SpringCM and Seal Software acquisition are likely to support the top-line growth, going forward. However, the company faces stiff competition in the e-signature market. Additionally, the company has made a significant investment in its product development, hence, failure to achieve market adoption in its business may hamper results of operations and financial condition.
Valuation Methodology: EV/Sales Multiple Based Relative Valuation (Illustrative)

EV/Sales Multiple Based Relative Valuation (Source: Refinitiv, Thomson Reuters)
Note: All the forecasted figures are taken from Thomson Reuters, NTM: Next Twelve Months
Stock Recommendation: The stock of DOCU closed at $163.91 with a market capitalization of ~$30.1 billion. The stock made a 52-week low and high of $43.13 and $172.21, respectively, and is currently trading at the upper band of its 52-week trading range. The stock went up by 25.1% and 99.76% in the last one month and three months, respectively. Debt to equity ratio in Apr’21 stood at 0.90x, higher than the industry median of 0.25x. We have valued the stock using the EV/Sales multiple based illustrative relative valuation method and arrived at a target price with the correction of low single-digit (in percentage terms). Hence, considering the above-mentioned factors, current trading levels and valuation, we have a watch stance on the stock at the current market price of $163.91, down 1.73% as on 24 June 2020.
Callon Petroleum Company
CPE Cancels Exchange Offer: Callon Petroleum Company (NYSE: CPE) is mainly engaged in the exploration, and production of oil and gas resources in the Permian Basin. On May 26, 2020, the company stated that it has terminated the previously announced private exchange offering of its 6.25% Senior Notes due 2023, its 8.25% Senior Notes due 2025, 6.125% Senior Notes due 2024 and 6.375% Senior Notes due 2026 to each Eligible Holder, in exchange of their Old Notes for up to $300,000,000 aggregate principal amount. Hence, none of the Old Notes will be accepted for exchange and no New Notes will be issued.
1QFY20 Key Highlights for the Period Ended 31 March 2020: During the quarter, the company reported adjusted earnings of 12 cents per share, down from 16 cents reported in the year-ago quarter, due to lower natural gas and oil price realizations along with elevated operating costs.The company reported operating revenues of $289.9 million, up from the year-ago figure of $153 million. Net production volumes during the quarter, averaged 100,955 barrels of oil equivalent per day (Boe/d), as compared to 40,311 Boe/d reported in 1QFY19. Improved volumes were due to operations in the Permian Basin and Eagle Ford Shale. During the quarter, the company reported total operating expenses of $242.1 million, up from $109.9 million reported in 1QFY19. The company exited the period with total cash and cash equivalents of $14.8 million, and long-term debt amounted to $3.2 billion.

1QFY20 Key Highlight (Source: Company Reports)
What to Expect: The company did not provide any outlook for FY20 in the wake of the COVID-19 pandemic. Nonetheless, it did issue some forecasts to give investors certain insights. In the June quarter, production is expected to be greater than 105 Mboe/d. For FY20, the company’s oil production is expected to be flat or more than its volumes recorded in the March quarter.
Key Risks: Higher expenses might dampen CPE’s profit margin in the coming quarters. Further, low cash balance and higher debt can affect the company’s growth projects. Further, volatile commodity prices add to the concerns.
Valuation Methodology: EV/EBITDA Multiple Based Relative Valuation (Illustrative)

EV/EBITDA Multiple Based Relative Valuation (Source: Refinitiv, Thomson Reuters)
Note: All forecasted figures have been taken from Thomson Reuters, NTM: Next Twelve Months
Stock Recommendation: The stock of CPE closed at $1.19 with a market capitalization of ~$472.4 million. The stock made a 52-week low and high of $0.38 and $7.01, respectively, and is currently trading at the lower band of its 52-week trading range. The stock has run up ~61.27% and ~131.07% in the last one month and three months, respectively. Notably, in Mar’20, the company’s debt to equity ratio stood at $0.94x, higher than the industry median of $0.78x. Considering the aforesaid facts and current trading levels, we have valued the stock using an EV/EBITDA multiple based illustrative relative valuation method. We have considered peers like WPX Energy Inc (NYSE: WPX), PDC Energy Inc (NASDAQ: PDCE), and SM Energy Co (NYSE: SM), and arrived at a target price of limited upside (in % terms). Hence, we have a wait and watch stance on the stock at the closing price of $1.19, down 13.14% as on 24 June 2020.
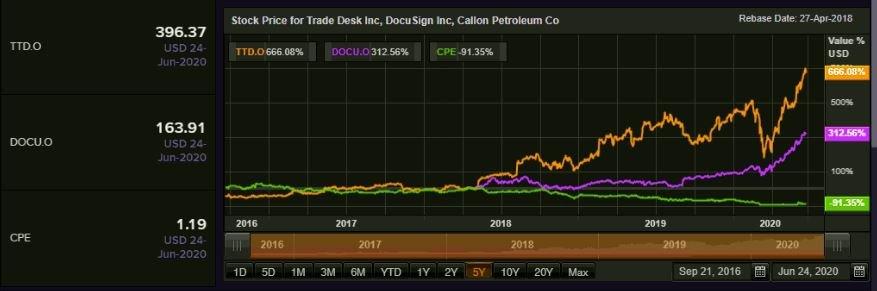
Comparative Price Chart (Source: Refinitiv, Thomson Reuters)
Disclaimer
The advice given by Kalkine Pty Ltd and provided on this website is general information only and it does not take into account your investment objectives, financial situation or needs. You should therefore consider whether the advice is appropriate to your investment objectives, financial situation and needs before acting upon it. You should seek advice from a financial adviser, stockbroker or other professional (including taxation and legal advice) as necessary before acting on any advice. Not all investments are appropriate for all people. Kalkine.com.au and associated pages are published by Kalkine Pty Ltd ABN 34 154 808 312 (Australian Financial Services License Number 425376). The information on this website has been prepared from a wide variety of sources, which Kalkine Pty Ltd, to the best of its knowledge and belief, considers accurate. You should make your own enquiries about any investments and we strongly suggest you seek advice before acting upon any recommendation. Kalkine Pty Ltd has made every effort to ensure the reliability of information contained in its newsletters and websites. All information represents our views at the date of publication and may change without notice. To the extent permitted by law, Kalkine Pty Ltd excludes all liability for any loss or damage arising from the use of this website and any information published (including any indirect or consequential loss, any data loss or data corruption). If the law prohibits this exclusion, Kalkine Pty Ltd hereby limits its liability, to the extent permitted by law to the resupply of services. There may be a product disclosure statement or other offer document for the securities and financial products we write about in Kalkine Reports. You should obtain a copy of the product disclosure statement or offer document before making any decision about whether to acquire the security or product. The link to our Terms & Conditions has been provided please go through them and also have a read of the Financial Services Guide. On the date of publishing this report (mentioned on the website), employees and/or associates of Kalkine Pty Ltd do not hold positions in any of the stocks covered on the website. These stocks can change any time and readers of the reports should not consider these stocks as personalised advice.
 AU
AU

 Please wait processing your request...