
Stocks’ Details
Danaher Corporation
Update on First-Quarter Results & Withdrawal of Guidance: Danaher Corporation (NYSE: DHR) is a worldwide conglomerate that is engaged in designing, manufacturing, and marketing diverse lines of professional, industrial, commercial and consumer products. Recently, the company provided an update on the expected results for 1QFY20, for the period ended 3 April 2020 and withdrew its previously announced outlook for FY20, amid COVID-19 crisis. For 1QFY20, the company expects revenues to rise 3% and non-GAAP core revenues to increase ~4.5%. Notably, DHR, predicts robust momentum across its Radiometer, Cepheid, Pall and ChemTreat businesses to positively impact all its three business segments in the coming quarter. Nevertheless, the COVID-19 outbreak reduced demands in its more instrument-oriented businesses towards the end of 1QFY20.
DHR Closes Buyout of GE’s BioPharma business: Recently, the company stated that it has finalized the acquisition of General Electric Company’s BioPharma business. Post-acquisition, the business will be named as Cytiva and will be a separate operating entity within Danaher's Life Sciences segment.
4QFY19 Financial Highlights for the Period ended 31 December 2019: During the quarter, DHR reported adjusted earnings of $1.28 per share, up 12.3% from the year-ago quarter’s figure of $1.14. Net sales during the quarter stood at $4,868.4 million, an increase of 5.7% year over year. Selling, general and administrative expenses for the period increased 3.9%, whereas research and development expenses soared 6.4% year over year. The company reportedoperating income of $961.7 million, up 11.4% year over year. The company exited the period with cash and cash equivalents of $19,912.3 million, with long-term debt amounting to $21,516.7 million.
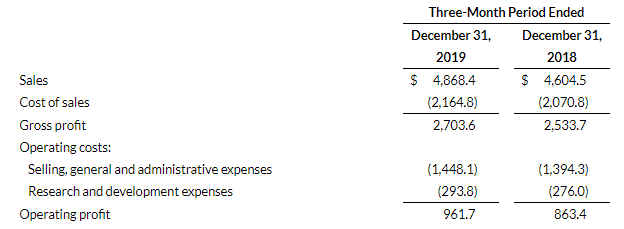
Key Financial Highlights (Source: Company Reports)
Valuation Methodology: EV/Sales Multiple Based Valuation
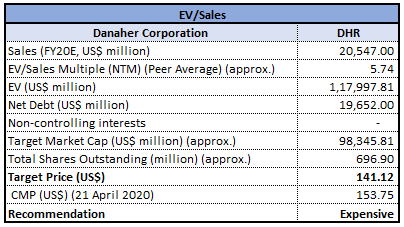
EV/Sales Based Valuation (Source: Thomson Reuters)
Note: All forecasted figures have been taken from Thomson Reuters, NTM: Next Twelve Months
Stock Recommendation: The stock of DHR closed at $153.75 with a market capitalization of ~$107.1 billion and a P/E multiple of 37.96x. The stock has made a 52-week low and high of $119.6 and $169.19 and is currently quoting close to the upper end of the range. Thestock has given positive returns of 24.18% and 21.28% in the last one month and one year, respectively. The company expects to report the first-quarter results on 07 May 2020.Considering the operational excellence, focused execution, and current trading level, we have valued the stock using EV/Sales multiple based illustrative relative valuation method and arrived at a correction of higher single-digit (in % terms). For the purpose, we have considered peers like Thermo Fisher Scientific Inc (NYSE: TMO), Illumina Inc (NASDAQ: ILMN), and Hologic Inc (NASDAQ: HOLX), to name few. Considering the current trading levels, recent price movement, a high P/E multiple, and valuation, we give an “Expensive” rating on the stock at the current market price of $153.75, down 1.33% as on 21 April 2020.
Exxon Mobil Corp
Initiatives to Curb COVID-19 Outbreak: Exxon Mobil Corp (NYSE: XOM) is engaged in the exploration and production of crude oil and natural gas. On April 16, 2020, the company took necessary measures to curb the coronavirus led crisis. In doing so, XOM provided thousands of meals and medical face masks for Houston-area health care workers, police officers and firefighters, bringing total contributions for Houston-area pandemic relief to $450,000. In another update, the company stated that it has increased its production capacity of specialized polypropylene, which is used in medical masks and gowns, by ~1,000 tonnes per month.
Other Recent Updates: On April 9, 2020, the company stated that it is steering field trials of eight emerging methane detection technologies, at ~1,000 sites in Texas and New Mexico to decrease methane emissions.
XOM to Cut FY20 Capex by 30%: On 7 April 2020,the company stated that it intends to cut capital spending by 30% or $10 billion in 2020, from its previous outlook of $33 billion.The move was taken owing to low commodity prices stemming from oversupply and demand weakness due to the COVID-19 pandemic. Further, the company also plans to slash cash operating expenses by ~15% to improve profit levels amid a low oil and gas pricing environment.
FY19 Business Highlights for the period ended 31 December 2019: In FY19, the company reported total revenues and other income of $264,938 million, down from $290,212 million in FY18. The business reported total earnings from its upstream segment of $14,442 million, up from $14,079 million in FY18. The business reported downstream earnings of $2,323 million, as compared to $6,010 million in FY18, on the back of lower margins comprising narrower North America crude differentials within the U.S segment and lower margins comprising unfavorable mark-to-market derivatives within the non-US segment.
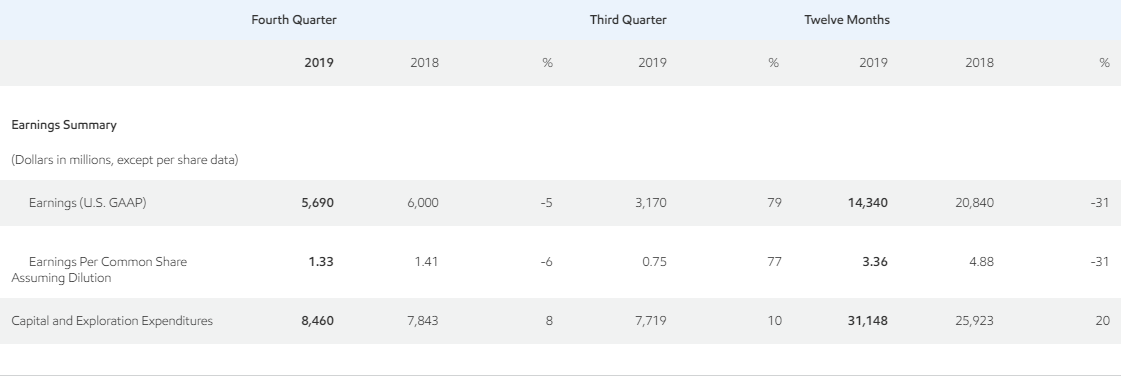
Key Financial Highlights (Source: Company Reports)
Valuation Methodology:EV/Sales Multiple Based Relative Valuation
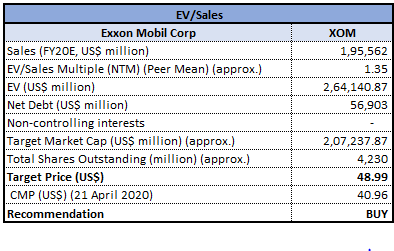
EV/Sales Based Relative Valuation (Source: Thomson Reuters)
Note: All the forecasted figures are taken from Thomson Reuters, NTM: Next Twelve Months
Stock Recommendation: The stock of XOM closed at $40.96 with a market capitalization of ~$173.3 billion. The stock made a 52-week low and high of $30.11 and $83.49 and is currently trading at the lower band of the range. Thestock witnessed a sharp correction of 39.39% and 49.51% in the last three months and one year, respectively.Given the current oil market scenario, the stock has seen a roller coaster ride in the recent times. Considering the aforesaid facts, current trading levels and business prospects, we have valued the stock using EV/Sales based illustrative relative valuation method. For the purpose, we have considered peers like Chevron Corp (NYSE: CVX), ConocoPhillips (NYSE: COP) and Halliburton Co (NYSE: HAL), to name few and arrived at a target price with lower double-digit upside (in % terms). Given the current oil market scenario and covid-19 impact on the businesses, dampened activities, etc., the stock has seen a roller-coaster ride in the recent times. However, we believe that long-term outlook for the company remains intact and with the revival in the economic activities, demand for the products is likely to see an improvement, going forward. Hence, we give a ‘Buy’ recommendation on the stock at the closing price of $40.96, down 0.53% as on 21 April 2020.
Primerica, Inc.
PRI Donates Grants to the CDC Foundation: Primerica, Inc. (NYSE: PRI) is a leading provider of financial products and services. It supports clients in addressing their needs for term life insurance, mutual funds, variable annuities, and other financial products, which it delivers primarily on behalf of third parties. On 26 March 2020, the company stated that The Primerica Foundation has contributed $175,000 to the COVID-19 relief efforts via grants to the U.S. Centers for Disease Control and Prevention Foundation. The move was taken to support the response to the COVID-19 pandemic.
4QFY19 Financial Highlights for the Period ended 31 December 2019: During the quarter, PRI reported adjusted operating revenues of $530.9 million, up 9% year over year. Adjusted net operating income during the quarter stood at $92.8 million, up 6% year over year, while diluted adjusted operating earnings per share soared 10% and came in at $2.22. The results were augmented byrobust performance in both the Term Life and Investment and Savings Products (ISP) segments. Notably, revenues from Term Life increased 9% year-over-year, whereas ISP segment saw a revenue increase of 11% year over year. During the quarter, the board repurchased $44 million shares and increased dividends by 18% to $0.40 per share, which was payable on March 16, 2020. The company exited the period with cash and cash equivalents of $256.9 million.
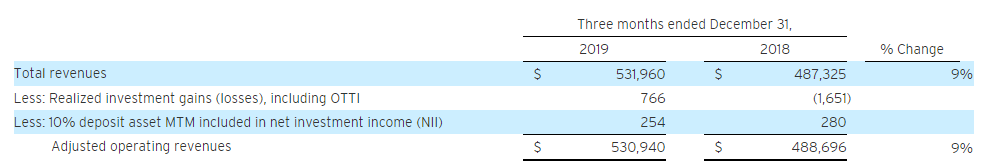
Revenue Highlights (Source: Company Reports)
Stock Recommendation: The stock of PRI closed at $92 with a market capitalization of ~$3.8 billion. The stock has made a 52-week low and high of $61.2 and $138.05 and is currently quoting at the lower band of the range. The stock witnessed a sharp correction of 27.22% and 26.96% in the last three months and one year, respectively. First-quarter results for the company are scheduled to be announced on April 29, 2020. On the valuation front, the stock is trading at a P/BV multiple of 2.3x as compared to the industry mean of 1.8x on TTM (Trailing Twelve Months) basis. Further, the stock is trading at a P/E multiple of 10.7x as compared to the industry median of 8.1x on TTM basis. Considering the aforesaid facts, valuations on TTM basis, and upcoming results, we have a watch stance on the stock at the current market price of $92, down 4.48% as on 21 April 2020.
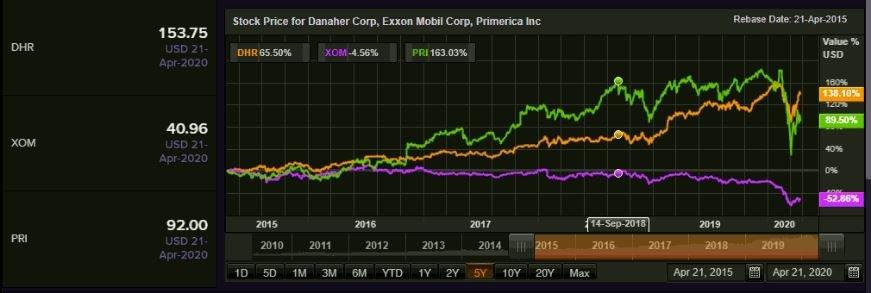
Comparative Price Chart (Source: Thomson Reuters)
Disclaimer
The advice given by Kalkine Pty Ltd and provided on this website is general information only and it does not take into account your investment objectives, financial situation or needs. You should therefore consider whether the advice is appropriate to your investment objectives, financial situation and needs before acting upon it. You should seek advice from a financial adviser, stockbroker or other professional (including taxation and legal advice) as necessary before acting on any advice. Not all investments are appropriate for all people. Kalkine.com.au and associated pages are published by Kalkine Pty Ltd ABN 34 154 808 312 (Australian Financial Services License Number 425376). The information on this website has been prepared from a wide variety of sources, which Kalkine Pty Ltd, to the best of its knowledge and belief, considers accurate. You should make your own enquiries about any investments and we strongly suggest you seek advice before acting upon any recommendation. Kalkine Pty Ltd has made every effort to ensure the reliability of information contained in its newsletters and websites. All information represents our views at the date of publication and may change without notice. To the extent permitted by law, Kalkine Pty Ltd excludes all liability for any loss or damage arising from the use of this website and any information published (including any indirect or consequential loss, any data loss or data corruption). If the law prohibits this exclusion, Kalkine Pty Ltd hereby limits its liability, to the extent permitted by law to the resupply of services. There may be a product disclosure statement or other offer document for the securities and financial products we write about in Kalkine Reports. You should obtain a copy of the product disclosure statement or offer document before making any decision about whether to acquire the security or product. The link to our Terms & Conditions has been provided please go through them and also have a read of the Financial Services Guide. On the date of publishing this report (mentioned on the website), employees and/or associates of Kalkine Pty Ltd do not hold positions in any of the stocks covered on the website. These stocks can change any time and readers of the reports should not consider these stocks as personalised advice.
 AU
AU

 Please wait processing your request...