Beyond Meat, Inc.
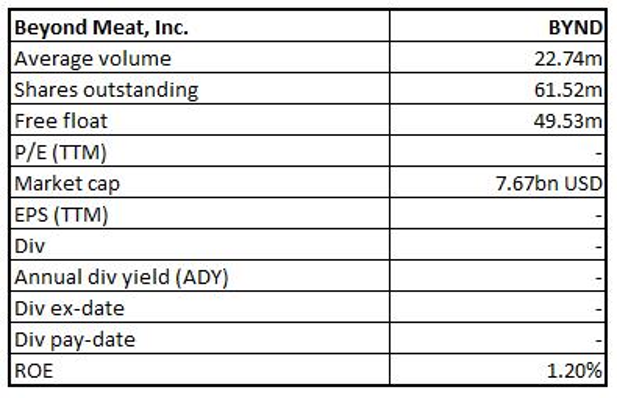
BYND Details
Gross Margin at 35.6% in Q3FY19: Beyond Meat, Inc. (NASDAQ: BYND) is a US-based food company that operates in innovative plant-based meats and is available at~58,000 retail and foodservice outlets across the world.
Q3FY19 Operational Highlights for the Period ended 28 September 2019:BYND announced its quarterly results, wherein the company reported net revenues of $91.96 million as compared to $26.28 million in the previous corresponding period. The increase was aided by higher sales volumes of products in Beyond Meat’s fresh platform across restaurant, retail & foodservice channels. The business witnessed an expansion in the distribution points, including new strategic customers, international customers, and higher demand from existing customers. Gross profit came in at $32.78 million, higher than $5.04 million in Q3FY18. Gross margin came in at 35.6% as compared to 19.2% in the previous corresponding period, driven by an increase in the volume of products sold, resulting in operating leverage and production efficiency improvements. The business turned into profitability at $4.09 million from a net loss of $9.34 million in the previous corresponding period. Capital expenditure during the first nine months of FY19, came in at $16.9 million as compared to $18.3 million in the prior corresponding period.
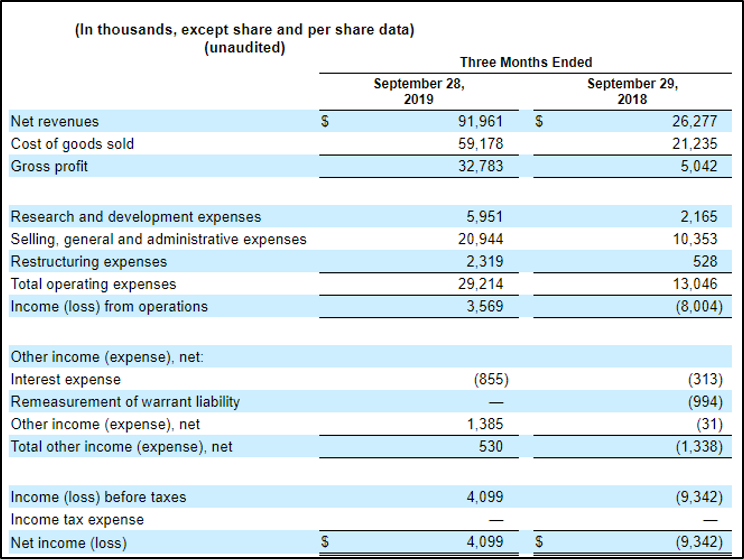
Q3FY19 Income Statement Highlights (Source: Company Reports)
Outlook:For FY19, the company expects net revenue within the range of $265 million to $275 million, while EBITDA is expected at ~$20 million.
Stock Recommendation: The stock of BYND closed at $124.75 with a market capitalization of ~$7.67 billion. The stock is currently quoting below the average of its 52-week high-low of $45.00 and $239.71, respectively. Thebusiness reported first quarterly profit, driven with improved margins aided by strong sales growth in both retail and restaurant and foodservice segment.The stock has generated positive returns of 64.92% and 18.34% in the last one month and three months, respectively. The stock is available at Enterprise Value (EV) to Sales multiple of 26.3x on trailing twelve months (TTM) basis as compared to the industry median (Consumer Non-Cyclicals) of 1.5x. On a price to book value-based valuation, the stock is available at 20.0x on its TTM basis as compared to the Industry median (Consumer Non-Cyclicals) of 1.6x.Considering the recent price movement, trading levels and valuations, we have a watch stance on the stock at the closing price of $124.75, up 4.4% as on 27 January 2020.
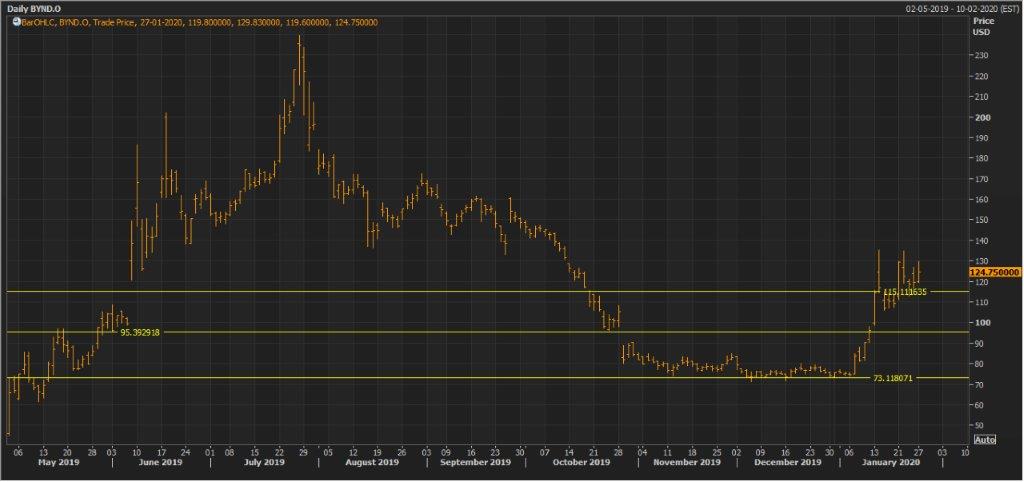
BYND Daily Technical Chart (Source: Thomson Reuters)
Virgin Galactic Holdings, Inc.
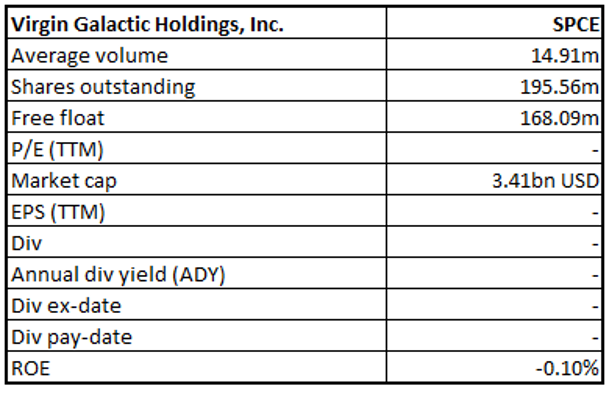
SPCE Details
Losses in 3QFY19 Increased on pcp: Virgin Galactic Holdings, Inc. (NYSE: SPCE) is a vertically integrated aerospace company, specialized in revolutionary human spaceflight for private individuals and researchers.
Q3FY19 Operational Highlights for the Period ended 30 September 2019: SPCE announced its quarterly results, wherein the company reported a loss from operation at $4.21 million as compared to a loss of $0.22 million in the previous corresponding period. The company reported a net loss of $0.48 million as compared to a profit of $3.03 million in the previous corresponding period. The company’s reported total current assets at $0.12 million while total assets stood at $677.29 million as on 30 September 2019. Total Shareholder’s equity stood at $5 million at the end of Q3FY19. The company reported net cash used in operating activities at $1.75 million, net cash provided by investing activities at $39.09 million and net cash used in financing activities at $37.75 million during the nine months of FY19.
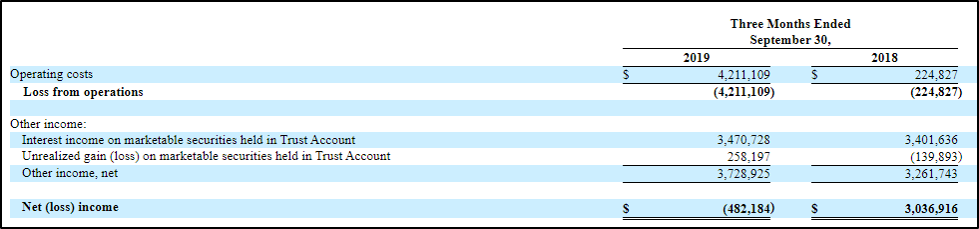
Q3FY19 Income Statement Highlights (Source: Company Reports)
Stock Recommendation: The stock of SPCE closed at $17.44 with a market capitalization of ~$3.41 billion. The stock is currently quoting towards the upper band of its 52-week range of $6.90 and $19.84. The stock has generated positive returns of 48.42% and 66.73% in the three six months and six months, respectively. Considering the recent results, price movement and trading levels, we have a watch stance on the stock at the closing price of $17.44, up 1.34% as on 27 January 2020.

SPCE Daily Technical Chart (Source: Thomson Reuters)
Frontline Ltd.
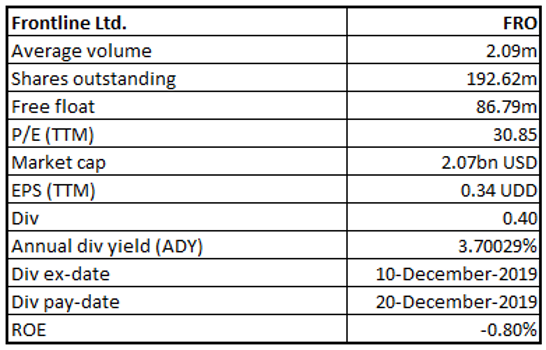
FRO Details
Expects Improved Business Prospect from Tanker Segment:Frontline Ltd. (NYSE: FRO) is a Bermuda-based shipping company, engaged primarily in the ownership and operation of oil tankers and product tankers.
Q3FY19Operational Highlights for the Period ended 30 September 2019: FRO announced its quarterly results, wherein the business reported total operating revenues at $187.64 million as compared to $188.77 million in the previous corresponding period. Net operating income came in at $12.11 million as compared to $23.10 million in Q3FY18 on account of increase in total operating expenses and lower operating gains. The company reported net loss of $9.96 million as compared to a profit of $2.33 million in Q3FY18. Cash and cash equivalent were reported at $103.83 million while total current assets were reported at $316.96 million as on 30 September 2019. The company exited the quarter with total assets of $3,588.44 million and total equity of $1,379.89 million. In October 2019, the company stated the extension of its senior unsecured rotating credit facility of ~ $275 million with an affiliate of the company’s shareholder, Hemen Holding Ltd. to May 2021.
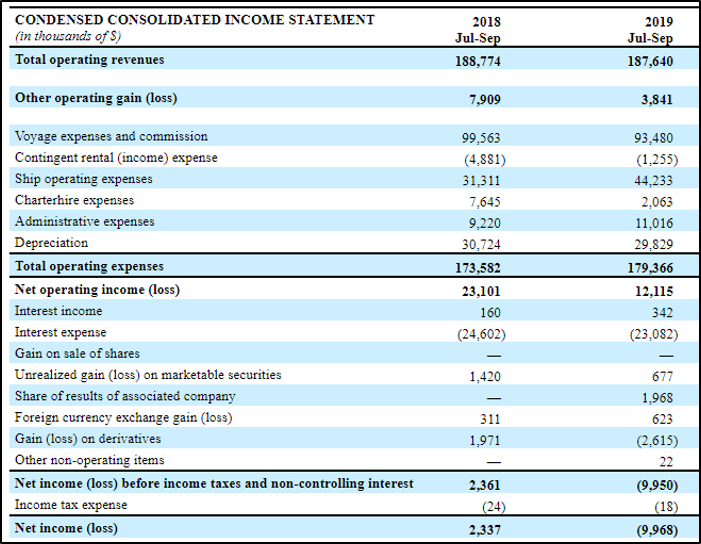
Q3FY19 Financial Highlights (Source: Company Reports)
Stock Recommendation:The stock of FRO closed at $10.49 with a market capitalization of ~$2.07 billion. The stock is currently quoting towards the upper band of its 52-week trading range of $4.82 and $13.33. The stock has generated negative returns of 13.77% and 2.17% in the last one month and three months, respectively. The tanker market looks encouraging and the company has delivered robust earnings from the vessel segment. The company remains focused to increase its spot exposure throughout the year. The momentum is expected to continue in the fourth quarter results. Considering the aforesaid facts, lower margins and losses in the latest quarterly results, we have a watch stance on the stock at the closing price of $10.49, down 2.96% as on 27 January 2020.
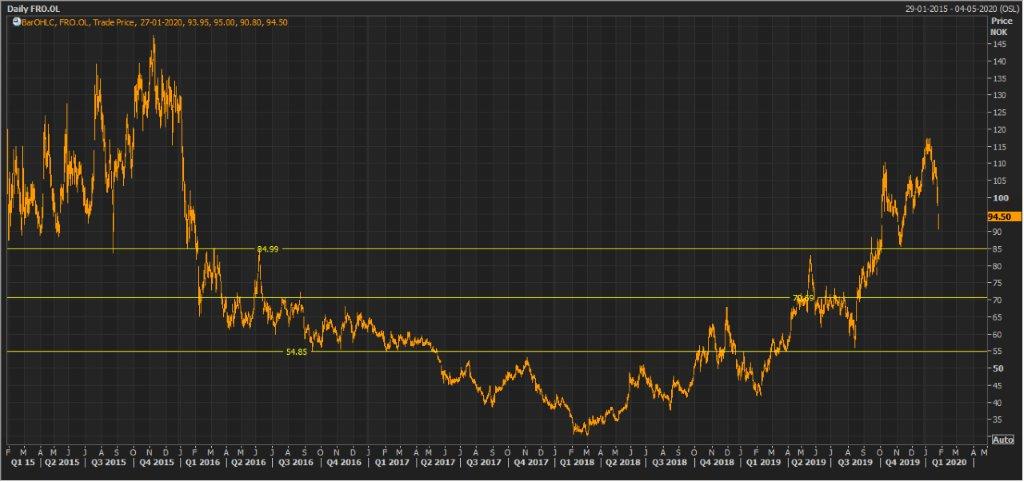
FRO Daily Technical Chart (Source: Thomson Reuters)
 AU
AU

 Please wait processing your request...