
Stocks’ Details
Clear Channel Outdoor Holdings, Inc
A look at CCO’s 1QFY20 Financial Highlight: Clear Channel Outdoor Holdings, Inc (NYSE: CCO) is a worldwide leader in outdoor advertising displays in countries across continents. It is engaged in operating advertising displays in the United States and has a presence in the top DMA regions. During the quarter for the period ended 31 March 2020, the company reported total revenue of $550.8 million, 6.2% down from the year-ago figure of $587.1 million. The decrease in revenue was mainly due to COVID-19 pandemic. Nonetheless, the company is implementing a robust strategy to increase liquidity and maintain financial flexibility and support the continuity of its platform along with cost savings initiatives. These deployments will aid the company to lessen the impact of COVID-19. Revenues from America during the quarter came in at $295.8 million, up 8.5% year over year, on the back of higher organic growth and the deployment of new digital displays. Revenues from Europe went down 13.2% year over year, owing to lower revenue in Spain and Switzerland due to non-renewal of contracts.
During the quarter, the company reported a net loss of $277.5 million as compared to a net loss of $164.2 million reported in the year-ago period. In 1QFY20, the company reported an adjusted EBITDA of ~$51.3 million, down 46.3% from the previous corresponding period. The company exited the period with a cash balance of $371.8 million, and net debt amounting to $4.8 million as of 31st March 2020.
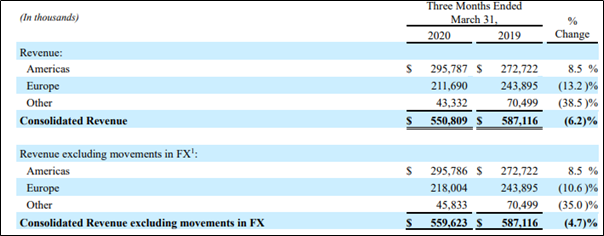
Key Highlights (Source: Company Report)
What to Expect: COVID-19 outbreak is expected to impact CCO’s Q2 revenues and Adjusted EBITDA. The company is, however, taking necessary measures to strengthen its balance sheet and further improve its liquidity position and increase its financial flexibility.
Stock Recommendation: The stock of CCO closed at $1.23 with a market capitalization of $574.8 million. The stock made a 52-week low and high of $0.36 and $5.4 and is currently trading at the lower band of the range. The stock has corrected 11.51% in the three-months but went up by 44.71% in the last one-month period. The company remains confident and focuses on executing its digital transformation plan to grow out-of-home’s share of total media spend and enhance long-term value for its shareholders. On the valuation front, the stock is trading at an EV/Sales multiple of 2.6x as compared to the industry median (Consumer Cyclicals) of 1.2x on TTM (Trailing Twelve Months) basis. Considering the aforesaid facts, current trading levels, and recent price movements, we have a watch stance on the stock at the closing price of $1.23, down 8.89% as on 10 June 2020.
Advanced Micro Devices, Inc.
AMD’s 2nd Gen-EPYC Processor Chosen by NVDA and AMZN’s AWS: Advanced Micro Devices, Inc. (NASDAQ: AMD) is engaged in developing high-performance computing and visualization products and has strengthened its foothold in the semiconductor market. Recently, AMD stated that its second-gen AMD EPYC processors have been chosen by NVIDIA and Amazon’s cloud division, Amazon Web Services (AWS), to deliver enhanced processing power to customers. Markedly, NVIDIA’s latest DGX A100 high-performance computing system will power second-generation EPYC processors’ high core count to provide the best possible performance to enterprises. This increasing usage of second-gen EPYC processors by both the companies is expected to boost AMD’s revenues in the forthcoming days.
AMD Unveils Radeon Pro VII graphics card: On 13 May 2020, the company launched Radeon Pro VII graphics card, which is intended to meet the growing demand of visual designers and engineers. The graphics card is designed to handle complicated media and broadcasting projects. These robust features will garner additional revenues for AMD.
Q1FY20 Operational Highlights for the Period ended 28 March 2020: During the quarter, the company reported non-GAAP earnings of 18 cents per share. Revenues stood at $1.79 billion, up 40% from the prior corresponding period. The increase was backed by robust strength in Computing and Graphics, and Enterprise segment. The revenue from Computing and Graphics segment increased 73% year over year and came in at $1.44 billion, whereas, Enterprise, Embedded and Semi-Custom segment revenues stood at $348 million, down 21% year over year. Non-GAAP gross margin during the quarter came in at 46%, up 5pp year over year. Adjusted EBITDA stood at $304 million, up 133.8% year over year.
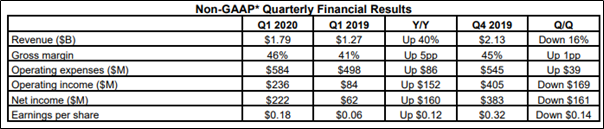
Key Highlights (Source: Company Report)
Balance Sheet & Cash Flow Highlight: The company exited the period with cash balance of $1.4 billion, and total debt (long-term plus short-term) amounted to $488 million. Operating cash outflow during the quarter came in at $65 million and free cash outflow amounted to $120 million.
Future Expectation: For 2QFY20, the company predicts strong sales from Ryzen and EPYC processor. Additionally, AMD expects a quarter over quarter rise in revenues due to growth in EPYC processor and semi-custom sales. The company expects non-GAAP gross margin to be ~44%. For 2020, AMD projects revenues to increase 25% (+/-5%) year over year despite the soft demand environment led by COVID-19 crisis.
Valuation Methodology: EV/Sales Based Relative Valuation (Illustrative)
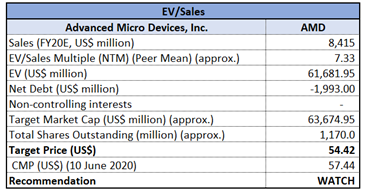
EV/Sales based relative valuation (Source: Refinitiv, Thomson Reuters)
Note: All the forecasted figures are taken from Thomson Reuters, NTM: Next Twelve Months
Stock Recommendation: The stock of AMD closed at $57.44 with a market capitalization of $67.3 billion. The stock made a 52-week low and high of $27.43 and $59.27 and is currently trading at the upper band of the range. The stock gave a positive return of 30.3% in the three-months. Considering the aforesaid facts, current trading levels, and recent price movements, we have valued the stock using the EV/Sales multiple based illustrative relative valuation method and arrived at a target price with a low single-digit correction (in % terms). For the purpose, we have taken the peer group - NVIDIA Corp (NASDAQ: NVDA), Texas Instruments Inc (NASDAQ: TXN) and Xilinx Inc (NASDAQ: XLNX), to name few. Given the aforesaid facts, current trading levels, financial performance, and recent update, we have a watch stance on the stock at the closing price of $57.44, up 1.86% as on 10 June 2020.
Johnson & Johnson
Revenues in 1QFY20 up 3.3% Year over Year: Johnson & Johnson (NYSE: JNJ) is engaged in the research and development, manufacturing, and sale of a multiple range of personal care hygienic products, pharmaceuticals, and surgical equipment. On June 10, 2020, the company stated that it has enhanced the commencement of the Phase 1/2a first-in-human clinical trial of SARS-CoV-2 vaccine, Ad26.COV2-S, recombinant, via its Janssen subsidiary. The trial is predicted to begin in the 2H of July 2020. In another update, Janssen stated that the European Commission has awarded marketing approval for Darzalex (daratumumab), the subcutaneous (“SC”) formulation of blood cancer drug, as a therapy for various myeloma (MM). The company also announced that it has received an approval from the U.S. Food and Drug Administration (FDA) for a new pediatric formulation of SIRTURO® (bedaquiline).
1QFY20 Financial Highlights: During the quarter, the company reported adjusted earnings of $2.3 per share, up 9.5% on a year over year basis. Sales of the drug and consumer products giant stood at $20.69 billion, which increased 3.3% from the year-ago quarter, depicting an operational increase of 4.8%. In the domestic market, sales increased 5.6% year over year and came in at $10.7 billion. International sales for the first quarter rose 4.5% year over year.
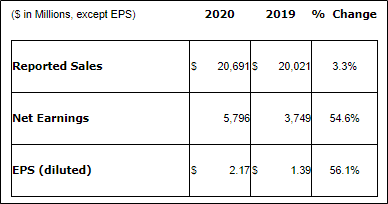
Q1FY20 Financial Highlights (Source: Company Reports)
Lowered Outlook for FY20: The company lowered its FY20 view due to coronavirus outbreak. It now anticipates FY20 adjusted earnings to be in the ambit of $7.50 to $7.90, down from the prior outlook of $8.95 - $9.10. Revenue for FY20 is now expected in the range of $77.5-$80.5 billion, down from the prior outlook of $85.4-$86.2 billion. Operational constant currency sales growth is now expected to be flat to down 3.5% as compared to the previously anticipated growth range of 4.5%-5.5%.
Valuation Methodology: EV/Sales Multiple Based Relative Valuation (Illustrative)
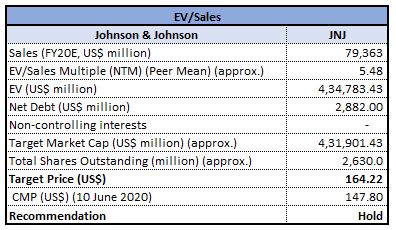
EV/Sales Based Valuation (Source: Refinitiv, Thomson Reuters)
Note: All forecasted figures and peers have been taken from Thomson Reuters, NTM-Next Twelve Months
Stock Recommendation: The stock of JNJ is quoting at $147.8 with a market capitalization of $389.6 billion. The stock is currently quoting at the upper band of its 52-week trading range of $109.16 to $157. The stock has given positive returns of ~6.98% and ~5.35% in the last three months and one year, respectively. The company expects to report its 2QFY20 results on 16 July 2020. The company is confident that its business will grow on the back of its strong portfolio of products. Considering the aforesaid facts, outlook amid COVID-19 outbreak and current trading levels, we have valued the stock using an EV/Sales multiple based illustrative relative valuation method. We have taken the peer group - Eli Lilly and Co (NYSE: LLY), Pfizer Inc (NYSE: PFE), Amgen Inc (NASDAQ: AMGN), to name few and arrived at a target price of lower double-digit upside (in % terms). Hence, we recommend a “Hold” rating on the stock at the closed price of $147.8, up 1.26% as on 10 June 2020.
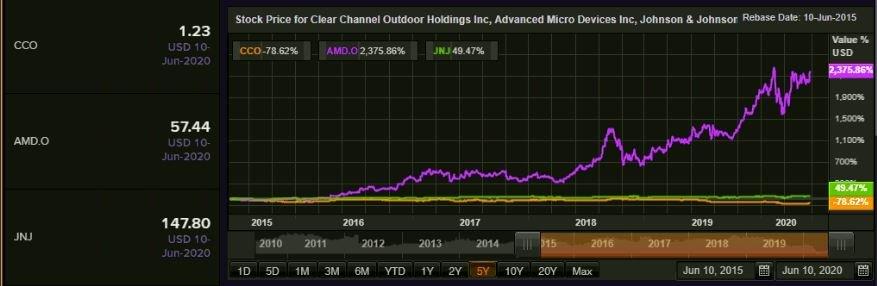
Comparative Price Chart (Source: Refinitiv, Thomson Reuters)
Disclaimer
The advice given by Kalkine Pty Ltd and provided on this website is general information only and it does not take into account your investment objectives, financial situation or needs. You should therefore consider whether the advice is appropriate to your investment objectives, financial situation and needs before acting upon it. You should seek advice from a financial adviser, stockbroker or other professional (including taxation and legal advice) as necessary before acting on any advice. Not all investments are appropriate for all people. Kalkine.com.au and associated pages are published by Kalkine Pty Ltd ABN 34 154 808 312 (Australian Financial Services License Number 425376). The information on this website has been prepared from a wide variety of sources, which Kalkine Pty Ltd, to the best of its knowledge and belief, considers accurate. You should make your own enquiries about any investments and we strongly suggest you seek advice before acting upon any recommendation. Kalkine Pty Ltd has made every effort to ensure the reliability of information contained in its newsletters and websites. All information represents our views at the date of publication and may change without notice. To the extent permitted by law, Kalkine Pty Ltd excludes all liability for any loss or damage arising from the use of this website and any information published (including any indirect or consequential loss, any data loss or data corruption). If the law prohibits this exclusion, Kalkine Pty Ltd hereby limits its liability, to the extent permitted by law to the resupply of services. There may be a product disclosure statement or other offer document for the securities and financial products we write about in Kalkine Reports. You should obtain a copy of the product disclosure statement or offer document before making any decision about whether to acquire the security or product. The link to our Terms & Conditions has been provided please go through them and also have a read of the Financial Services Guide. On the date of publishing this report (mentioned on the website), employees and/or associates of Kalkine Pty Ltd do not hold positions in any of the stocks covered on the website. These stocks can change any time and readers of the reports should not consider these stocks as personalised advice.
 AU
AU

 Please wait processing your request...