The Goodyear Tire & Rubber Company
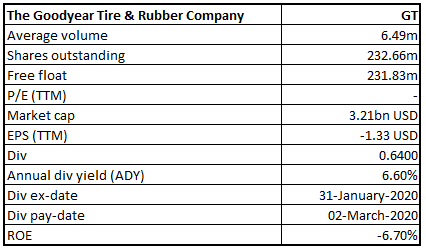
GT Details
Strong Cash Flow from Operations Driven by Improved Working Capital:The Goodyear Tire & Rubber Company (NASDAQ: GT) is engaged in the development, manufacturing, distribution and marketing of tires and related products and provides services worldwide. The company also manufactures and markets several lines of rubber tires for automobiles, trucks, buses, aircraft, motorcycles, etc.
FY19 Operational Highlights for the Period ended 31 December 2019: NWL announced its full-year results, wherein the company reported net sales of $14,745 million, down 5% on y-o-y basisdue to unfavorable foreign currency translation, lower volume and reduced third-party chemical sales.The business delivered improved working capital which resulted 32% y-o-y growth in cash flow from operations. The year was marked by growth in the premium, large-rim diameter segment, resulting in a 4% growth in the U.S. consumer replacement volume.The company reported better than the industry growth within the global commercial truck tire shipments. During the second half of FY19, the business delivered solid consumer replacement growth across both China and Brazil. Tire unit volumes, during the year stood at 39.6 million, down 2% from FY19, majorly due to a decline of 10% in the original equipment unit volume on account of lower global vehicle production while replacement tire shipments increased marginally. Operating income stood at $945 million, down from $1,274 million in FY18, on account of higher raw material costs, lower volume, a decrease in favorable indirect tax settlements in Brazil and unfavorable foreign currency translation.
.png)
Key FY19 Income Statement Highlights (Source: Company Reports)
Valuation Methodology:EV/Sales Based Valuation
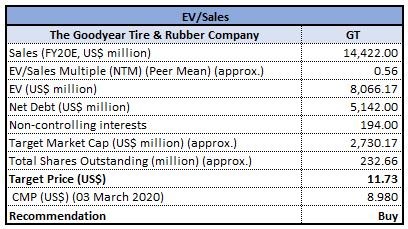
EV/Sales Based Valuation (Source: Thomson Reuters)
Note: All forecasted figures have been taken from Thomson Reuters, NTM: Next Twelve Months
Stock Recommendation:The stock of GT closed at $8.98 with a market capitalization of ~$2.09 billion. The stock made a 52-week low and high of $8.92 and $20.70 and is currently trading at the lower band of its 52-week trading range. The stock corrected by 42.50% and 17.76% in the last three months and six months, respectively.The U.S. market conditions remained largely stable and the consumer and commercial replacement businesses delivered strong performances in FY19, as it benefited from the strength of its brand, new product introductions, followed by new distributions strategies. Considering the aforesaid facts, current trading levels, recent price movements and the company’s brand presence, we have valued the stock using the Enterprise Value (EV) to Sales based relative valuation method. We have considered peers like Cooper Tire & Rubber Co (NYSE: CTB), Continental AG (OTC: CONG), Yokohama Rubber Co Ltd (OTC: YORUF) and arrived at a target price of double-digit upside (in% terms). Hence, we recommend a ‘Buy’ rating on the stock at the closing price of $8.98, down 5.37% as on 03rd March 2020.
Macy’s, Inc.
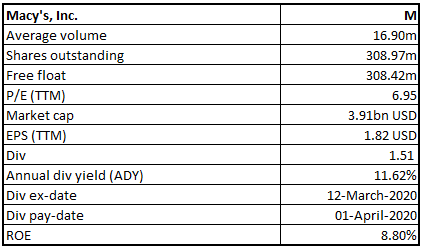
M Details
Polaris Strategy to Drive Operational Efficiency:Macy’s, Inc. (NASDAQ: M) is a retail-based company which operates across the fashion segment. The business has retail brands like Macy’s, Bloomingdale’s and Bluemercury.
FY19 Business Highlights for the Period ended 01 February 2020: Macy’s came up with its full year results, wherein the company reported net sales of $24,560 million, down from $24,971 million in FY18.Cost of sales stood at $15,171 million, representing 61.8% of the net sales, as compared to 60.9% in FY18. The company reported decline in the operating income of $970 million, as compared to $1,738 million in previous financial year. During FY19, the company emphasized on Polaris strategy in order to improve its operating performance in coming years. During FY19, the company made an expenditure of ~$318 million including non-cash impairment charges.
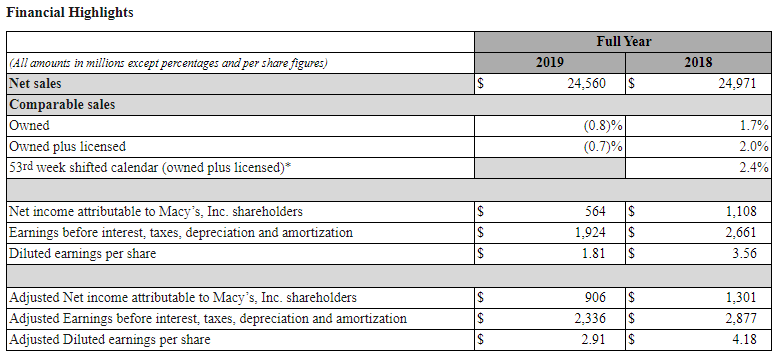
Key FY19 Operational Highlights (Source: Company Reports)
Guidance:For FY20, the company expects net sales within the range of $23.6 billion to $23.9 billion. Comparable sales are expected at ~40 basis points better than owned plus licensed. Adjusted diluted earnings per share is expected within the range of $2.45 to $2.65. The company expects gains from asset sale of ~$100 million. Annual tax rate is anticipated at around 23.25%.
Valuation Methodology:EV/Sales Based Valuation
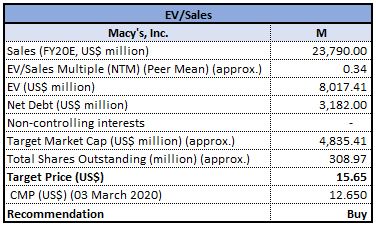
EV/Sales Based Valuation (Source: Thomson Reuters)
Note: All forecasted figures have been taken from Thomson Reuters, NTM: Next Twelve Months
Stock Recommendation:The stock of M closed at $12.65 with a market capitalization of ~$3.90 billion. The stock made a 52-week low and high of $12.41 and $26.33 and is currently trading at the lower band of its 52-week trading range. The stock corrected by 41.48% and 48.07% in the last nine months and one year, respectively. Going forward, the business is expected to deliver operational improvement from the implementation of Polaris Strategy.Considering the aforesaid facts, current trading levels, recent price movements and the company’s brand presence, we have valued the stock using one relative valuation method, i.e., Enterprise Value (EV) to Sales. We have considered peers like Kohls Corp (NYSE: KSS), Nordstrom Inc (NYSE: JWN), Gap Inc (NYSE: GPS) and arrived at a target price of double-digit upside (in% terms). Hence, we recommend a ‘Buy’ rating on the stock at the closing price of $12.65, down 2.62% as on 03rd March 2020.
Newell Brands Inc.
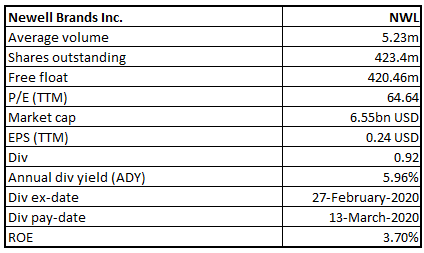
NWL Details
Reported Turnaround in Bottom-line:Newell Brands Inc. (NYSE: NWL) operates in consumer goods segment and has a strong portfolio of well-known brands, including Paper Mate®, Sharpie®, Dymo®, EXPO®, Parker®, Elmer’s® etc.
FY19 Operational Highlights for the Period ended 31st December 2019: NWL declared its full year results, wherein the company reported net sales of $9,714.9 million, down 4.3% on y-o-y basis on account of 1.9% decline in its core sales. The company reported an operating loss of $482 million compared with an operating loss of $7,554 million in FY18 on account of strict cost management on overheads, which was offset the gross margin headwinds. The company turned into profitability with a net profit $106.6 million, as compared to a loss of $6.9 billion in the prior year.
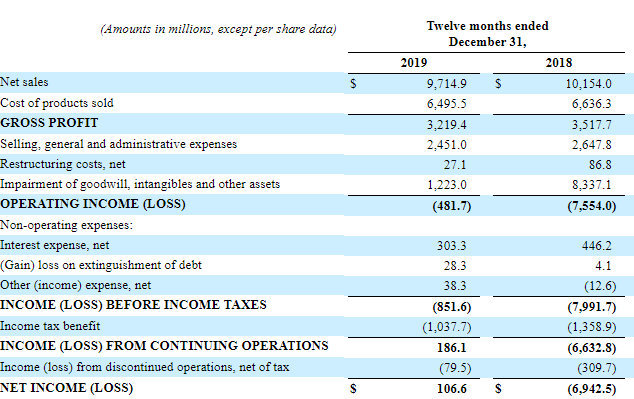
Income Statement Highlights (Source: Company Reports)
Guidance:For FY20, the company expects, net sales within the range of $9.4 billion to $9.55 billion while core sales are expected to remain flat or decline by ~2%. Operating Margin on normalized basis is expected to improve by 10 to 40 bps while operating margin is expected within the range of 10.9% to 11.2%. Normalized diluted EPS is anticipated in between $1.46 to $1.56. The company expects operating cash flow within the range of $1.0 billion to $1.15 billion.
Valuation Methodology: Price to Earnings Based Relative Valuation
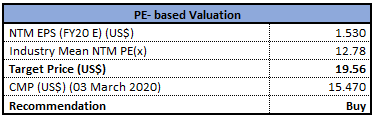
Price to Earnings based relative valuation (Source: Thomson Reuters)
Note: All the forecasted figures are taken from Thomson Reuters, NTM: Next Twelve Months
Stock Recommendation:The stock of NWL closed at $15.47 with a market capitalization of ~$6.54 billion. The stock made a 52-week low and high of $13.04 and $20.99 and is currently trading at the lower band of its 52-week trading range. The stock corrected by 20.78% and 16.96% in the last one month and three months, respectively.The Company is emphasizing on its turnaround strategy, with the goal of building a global, next generation consumer products company that can unleash the full potential of its brands in a fast moving omni-channel environment. Considering the aforesaid facts, current trading levels, recent price movements and improvement in bottom-line, we have valued the stock using the Price to Earnings based relative valuation method. We have considered peers like Spectrum Brands Holdings Inc (NYSE: SBP), PVH Corp (NYSE: PVH), Hasbro Inc (NYSE: HAS) and arrived at a target price of double-digit upside (in% terms). Hence, we recommend a ‘Buy’ rating on the stock at the closing price of $15.47, down 5.96% as on 03rd March 2020.
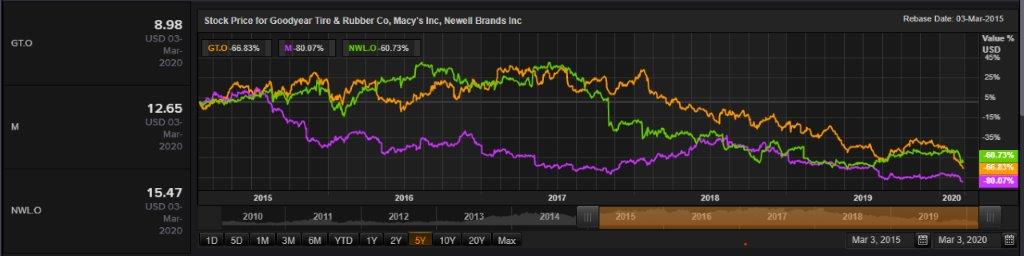
Comparative Price Chart (Source: Thomson Reuters)
Disclaimer
The advice given by Kalkine Pty Ltd and provided on this website is general information only and it does not take into account your investment objectives, financial situation or needs. You should therefore consider whether the advice is appropriate to your investment objectives, financial situation and needs before acting upon it. You should seek advice from a financial adviser, stockbroker or other professional (including taxation and legal advice) as necessary before acting on any advice. Not all investments are appropriate for all people. Kalkine.com.au and associated pages are published by Kalkine Pty Ltd ABN 34 154 808 312 (Australian Financial Services License Number 425376). The information on this website has been prepared from a wide variety of sources, which Kalkine Pty Ltd, to the best of its knowledge and belief, considers accurate. You should make your own enquiries about any investments and we strongly suggest you seek advice before acting upon any recommendation. Kalkine Pty Ltd has made every effort to ensure the reliability of information contained in its newsletters and websites. All information represents our views at the date of publication and may change without notice. To the extent permitted by law, Kalkine Pty Ltd excludes all liability for any loss or damage arising from the use of this website and any information published (including any indirect or consequential loss, any data loss or data corruption). If the law prohibits this exclusion, Kalkine Pty Ltd hereby limits its liability, to the extent permitted by law to the resupply of services. There may be a product disclosure statement or other offer document for the securities and financial products we write about in Kalkine Reports. You should obtain a copy of the product disclosure statement or offer document before making any decision about whether to acquire the security or product. The link to our Terms & Conditions has been provided please go through them and also have a read of the Financial Services Guide. On the date of publishing this report (mentioned on the website), employees and/or associates of Kalkine Pty Ltd do not hold positions in any of the stocks covered on the website. These stocks can change any time and readers of the reports should not consider these stocks as advice or recommendations.
 AU
AU

 Please wait processing your request...