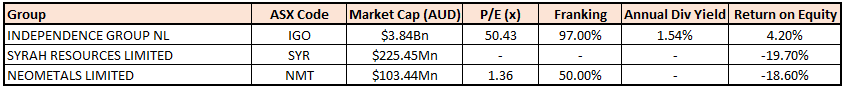
Stocks’ Details
Independence Group NL
Q2FY20 and H1FY20 Production Results Outperform Pro-Rata Guidance:Independence Group NL (ASX: IGO) is involved in the exploration and development of nickel, gold and silver.
On January 8, 2020, the company informed the market that its metal production for the second quarter and first half of FY20 exceeded the pro-rata guidance range for FY20. Gold production and sales at Tropicana also exceeded the pro-rata guidance for FY20. The second quarter result remained unaffected from the significant bushfire activity in the Shires of Dundas and Esperance which led to closures of the main Eyre Highway and Coolgardie-Esperance Highway. The company expects no material impact on the third quarter result. For Tropicana, full year production is expected to be within the guidance with lower gold production during second half of FY20, in-line with its mine plan.
September’19 Quarter Key Highlights (Q1FY20):Revenue and other income for the quarter increased by 29% to A$263.1 Mn on qoq basis, mainly due to higher Nova revenue of $184.2 Mn, which was $62.3 Mn higher than achieved in the previous quarter.Despite an increase of $51.8 Mn in trade debtors at Nova due to timing of shipments and revaluation of trade receivables, total cash from operating activities was reported at $89.4 Mn. Net cash at the end of the period was reported at $264.0 Mn.
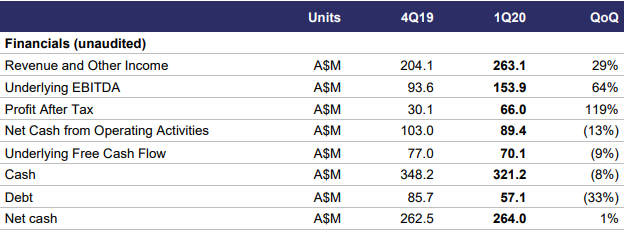
September Quarter Key Metrics (Source: Company Reports)
Financial Health of the company:Its gross margin and EBITDA margin for FY19 stood at 62.6% and 44.3%, better than the industry median of 41.1% and 29.1%, respectively, implying decent fundamental for the company. Its current ratio for FY19 stood at 4.44x, better than the industry median of 1.75x, which implies decent liquidity position for the company. Its debt to equity ratio for FY19 stood at 0.05x, lower than the industry median of 0.13x.
Valuation Methodology:EV/EBITDA Multiple Approach
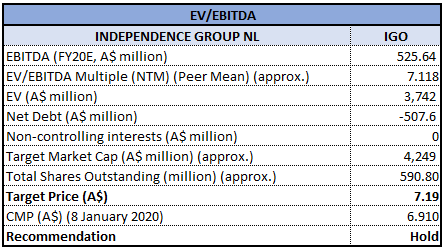
EV/EBITDA Based Valuation (Source: Thomson Reuters)
Stock Recommendation: The stock generated a positive YTD return of 5.35%, and in the span of six months, it has posted a return of 31.85%. The company aims to focus more on cost improvements and operational efficiencies, in order to deliver sustainable value to its customers and shareholders.Considering company’s Q2FY20 performance and FY20 guidance, we have valued the stock using EV/EBITDA based relative valuation method and for the purpose, have taken the peer group Regis Resources Ltd (ASX: RRL), OZ Minerals Ltd (ASX: OZL) and Northern Star Resources Ltd (ASX: NST). Therefore, we have arrived at a target price with a upside of lower single digit in % terms. Hence, we, recommend a “Hold” rating on the stock at the current market price of $6.910, up 6.308% on January 8, 2020 on account of an update related to first-half metal production, beating the guidance.
Syrah Resources Limited
Q4FY19 Cash Balance to be ~US$78 Mn:Syrah Resources Limited (ASX: SYR) operates in mining, exploration and distribution of graphite and related products. Recently, Credit Suisse Holdings (Australia) Limited ceased to be a substantial holder in the company, effective from January 3, 2020. On January 6, 2020, the company informed the market about the issuance of 178,145 shares at deemed issue price of $0.461 per share.
Update on Battery Anode Material (BAM) Project:Construction of the project is nearing construction and is progressing well on the commissioning of the purification circuit. Due to delays in some supplier technical support during commissioning, first production of purified spherical graphite is now expected in the last quarter of FY19.
Outlook:Due to the current market conditions, planned fourth quarter production has been reduced to around 5ktpm2. Cash balance at the end of Q4 has been estimated at ~US$78 million, which includes proceeds from the Convertible Note issue to AustralianSuper Pty Ltd.
Key Highlights of September’19 Quarter:Total Recordable Injury Frequency Rate (TRIFR) at the end of the quarter was reported at 0.6. Graphite production for the period was reported at 45kt as compared to 44kt in the previous quarter, mainly due to improvement in recovery. The company sold 45kt of graphite at a weighted average graphite price of US$391 per tonne (CIF) for the quarter. Lower price of graphite in the third quarter as compared to second quarter can be attributed to sudden and material decrease in spot prices across all flake sizes in China due to the negative coincidental factors and depreciation in Chinese Yuan.
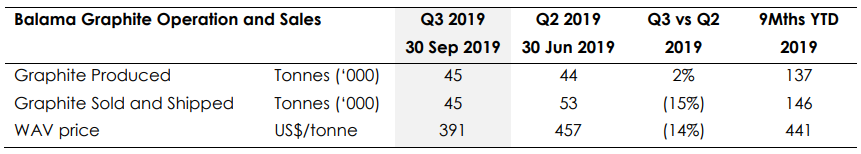
Q3FY19 Highlights (Source: Company Reports)
Net cash outflow from operating activities for the period was reported at US$9,329,000. Net cash outflow from investing activities for the period was reported at US$10,188,000. Net cash inflow from financing activities for the period was reported at US$20,643,000. Cash and cash equivalents at the end of the period was reported at US$65,499,000.
Financial Health of the company:Current ratio for H1FY19 stood at 4.23x, better than the industry median of 1.87x, implying decent liquidity position of the company. Debt to equity ratio and long-term debt to total capital for H1FY19 stood at 0.03x and 2.5%, lower than the industry median of 0.11x and 6.3%, respectively.
Valuation Methodology:EV/Sales Multiple Approach
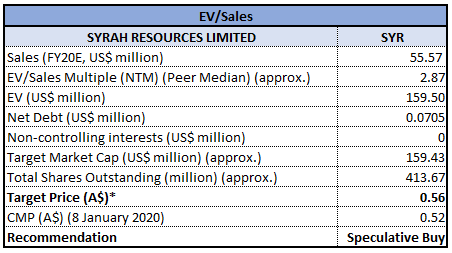
EV/Sales Based Valuation (Source: Thomson Reuters)
Stock Recommendation: The stock of SYR generated a positive YTD return of 9.00% and is currently trading close to its 52-week low level of $0.350. Considering the company’s BAM project, decent cash estimate for fourth quarter of FY19, and current trading levels, we have valued the stock using a relative valuation method, i.e., Enterprise value to sales (EV/Sales) multiple and for the purpose, have taken the peer group – Orocobre Ltd (ASX: ORE), Evolution Mining Ltd (ASX: EVN) and Regis Resources Ltd (ASX: RRL). Therefore, we have arrived at a target price of higher single-digit upside (in percentage terms). Hence, we recommend a ‘Speculative Buy’ on the stock at the current market price of $0.520, down 4.587% on 8th January 2020.
Neometals Limited
NMT Secures Funding from IMCRC:Neometals Limited (ASX: NMT) is involved in advancing its mineral projects and developing its technology business unit. Its three core projects include, Lithium-ion Battery Recycling; Lithium Refinery Project; and Barrambie Titanium and Vanadium Project.
On December 17, 2019, the company announced that it has secured a funding from Innovative Manufacturing CRC (IMCRC) for collaborative research project worth $2.57 million with Queensland University of Technology to set up a synthetic zeolite manufacturing plant. The company has been optimizing its patent pending process to convert lithium refinery residue into an advanced material known as synthetic zeolite. The pilot project has been scheduled to commence in February 2020 with operations to start by September 2020.
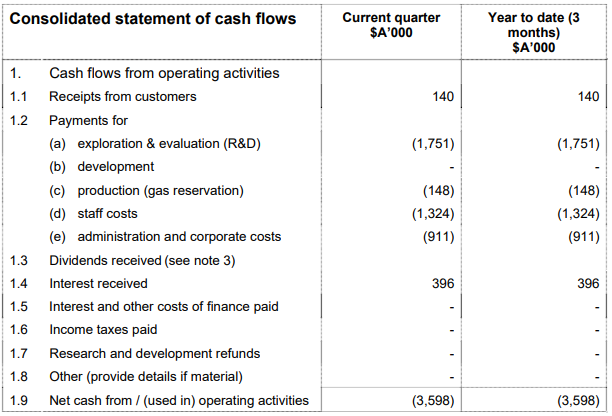
September’19 Quarter Operating Cash Flow Statement (Source: Company Reports)
Key Highlights of September’19 Quarter:Net cash outflow from operating activities for the period was reported at $3,598,000. Net cash outflow from investing activities for the period was reported at $2,948,000. Cash and cash equivalents at the end of the period stood at $107,064,000.
Stock Recommendation: The stock of NMT generated a negative YTD return of 2.56% and is currently trading on the lower band of its 52-weeks trading range of $0.170 - $0.244. CRC grant will help it in timely commencement of Pilot project activities. Success of the project is expected to drive a subsequent Class 3 Engineering Cost Study. These developments are expected to help the company in its endeavour to bring innovative products to the market and simultaneously enhance its earnings. Considering the above stated facts and current trading levels, we givea ‘Speculative Buy’ recommendation on the stock at the current market price of $0.190 as on 8th January 2020.
%20IGO.jpg)
Comparative Price Chart (Source: Thomson Reuters)
Disclaimer
The advice given by Kalkine Pty Ltd and provided on this website is general information only and it does not take into account your investment objectives, financial situation or needs. You should therefore consider whether the advice is appropriate to your investment objectives, financial situation and needs before acting upon it. You should seek advice from a financial adviser, stockbroker or other professional (including taxation and legal advice) as necessary before acting on any advice. Not all investments are appropriate for all people. Kalkine.com.au and associated pages are published by Kalkine Pty Ltd ABN 34 154 808 312 (Australian Financial Services License Number 425376). The information on this website has been prepared from a wide variety of sources, which Kalkine Pty Ltd, to the best of its knowledge and belief, considers accurate. You should make your own enquiries about any investments and we strongly suggest you seek advice before acting upon any recommendation. Kalkine Pty Ltd has made every effort to ensure the reliability of information contained in its newsletters and websites. All information represents our views at the date of publication and may change without notice. To the extent permitted by law, Kalkine Pty Ltd excludes all liability for any loss or damage arising from the use of this website and any information published (including any indirect or consequential loss, any data loss or data corruption). If the law prohibits this exclusion, Kalkine Pty Ltd hereby limits its liability, to the extent permitted by law to the resupply of services. There may be a product disclosure statement or other offer document for the securities and financial products we write about in Kalkine Reports. You should obtain a copy of the product disclosure statement or offer document before making any decision about whether to acquire the security or product. The link to our Terms & Conditions has been provided please go through them and also have a read of the Financial Services Guide. On the date of publishing this report (mentioned on the website), employees and/or associates of Kalkine Pty Ltd do not hold positions in any of the stocks covered on the website. These stocks can change any time and readers of the reports should not consider these stocks as advice or recommendations.
 AU
AU
 Please wait processing your request...