.png)
Stock Details
Resolute Mining Limited
FY19 Gold Production Stood at 384,731oz with an AISC of $1,577/oz: Resolute Mining Limited (ASX: RSG) operates in the exploration and development of Gold.
Q4FY19 Cash Flow Highlights for the Period ended 31 December 2019: RSG announced its quarterly cash flow highlight, wherein the company reported development expenditure at $42.9 million, followed by working capital movements at -$15.6 million.Overheads and operational Support costs stood at $12.5 million. The company reported inflows from its existing debt facilities at $49.3 million during the third quarter of FY19. The business reported closing cash and bullion at $150.7 million.
.png)
Q4FY19 Cash Flow Highlights (Source: Company Reports)
Q4FY19 Operational Highlights for the Period ended 31 December 2019:RSG reported a Gold production of 105,293oz at an ASIC of A$2,075/oz. For the entire FY19, the company reported gold production of 384,731oz at an AISC of A$1,577/oz. FY19 gold sales stood at 394,920oz at an average price received of A$1,933/oz. During the quarter, the company reported successful repairment of Syama roaster after being offline for the majority of the quarter. The quarter completed the capacity expansion of Ravenswood, wherein the company reported installation of 5Mtpa and procurement of Environmental Authority permit. Gold in circuit inventory as at 31 December 2019 stood at 74,389oz which was valued at A$161 million.
Guidance: As per the Management outlook, the company expects FY20 investment for exploration and other development capital expenditure to come in at US$25 million. The company expects FY20 production to be at ~500,000oz at an AISC of US$980/oz. RSG expects 260,000oz of production at US$960/oz from Syama project, 160,000oz at US$800/oz from Mako and 80,000oz at US$1,200/oz from Ravenswood project.
Valuation Methodology: Enterprise Value to EBITDA Multiple Approach
.png)
Enterprise Value to EBITDA Valuation (Source: Thomson Reuters)
Note: All forecasted figures and peers have been taken from Thomson Reuters, NTM-Next Twelve Months
Stock Recommendation: The stock of RSG is quoting at $1.190 with a market capitalization of $1.07 billion. Currently, the stock is quoting at the lower band of its 52-week trading range of $0.965 to $2.120. During the quarter, the company reported exceptional results from its exploration activities in Mali while the company reported positive free cash flows from its Mako projects. Considering the current trading levels and business prospects, we have valued the stock using one relative valuation method, i.e., Enterprise Value to EBITDA Multiple and arrived at a target price of lower double-digit (in percentage terms). Hence, we recommend a ‘BUY’ rating on the stock at the current market price of $1.190, up 0.847% as on 17 January 2020.
Nufarm Limited
Downgraded H1FY20 Earnings: Nufarm Limited (ASX: NUF) is engaged in the development and marketing of chemicals across Australia and Asia. On 17 January 2020, the company reported issuance of 55,372 ordinary shares for the purposes of the Nufarm Employee Global Share Plan.
Earnings Guidance for the First Half of FY20: NUF informed that the business is expected to deliver lower earnings for the first half of FY20 as compared to the previous corresponding period. The company expects EBITDA within the range of $55 million to $65 million. The company informed that the sales growth across South America, particularly in Brazil has continued while the business witnessed erosion in margins due to stiff competition and procurement of extra expenses due to launch of new products in the coming days. Within the North American segment, the earnings are likely to be impacted by $20 million due to the weak demand for crop protection products during Q1FY20. The business expects some good momentum from spring planting season while expects that the markets are likely to be competitive because of shift in customer preferences. Within the Europe, the business witnessed a shrink in margins due to an increase in raw material cost, marketing and logistics expenses due to higher competition. The segment is likely to record an EBITDA loss, which includes an additional rebate of $9 million. The Australia segment witnessed reduction in sales due to a continuation of extreme climatic conditions while the business may witness improvement during the remaining tenure of H1FY20 on account of forecast of rainfall. Difficult climatic conditions and rise in the inventory levels due to tepid demand across Asia are likely to lower the earnings from this segment as compared to the previous corresponding period.
Valuation Methodology: Price to Cash Flow Based valuation
.png)
Price to Cash Flow based Valuation (Source: Thomson Reuters)
Note: All forecasted figures and peers have been taken from Thomson Reuters, NTM-Next Twelve Months
Stock Recommendation: The stock of NUF is quoting at $5.480 with a market capitalization ~$2.31 billion. The stock has generated a mixed return of -7.16% and 38.41% in the last three months and six months, respectively. The stock is quoting at the upper band of its 52-week trading range of $3.605 to $6.940. The business has lowered its H1FY19 guidance due to higher costs, lower demand, difficult climatic conditions and stiff competition within the market. Considering the aforesaid facts, we have valued the stock using one relative valuation method, i.e., price to cash flow based approach. We have taken peers such as Graincorp Ltd (ASX: GNC), ALS Ltd (ASX: ALQ), Rural Funds Group (ASX: RFF) and arrived at a target price of very limited upside (in % terms). Hence, we have a watch rating on the stock at the current market price of $5.480 per share, down 10.016% as on 17 January 2020, on account of earnings downgrade.
Sezzle Inc.
Approval of Lending License in California: Sezzle Inc. (ASX: SZL) is a financial technology company that provides payment related services through its platform. On 17 January 2020, the company announced the recipient of the approval of its lending license in the State of California by the State of California Department of Business Oversight.
Q3FY19 Operational Highlights for the Period ended 30 September 2019: SZL declared its quarterly results, wherein the company reported active merchants at 7,507, up 48.7% on q-o-q basis. Active Customers came in at 644,509, depicting a growth of 49.9% on q-o-q basis. Underlying Merchant Sales (UMS) came in at US$68.8 million, up 64.2% on q-o-q basis while Underlying Merchant Fees came in at US$3.6 million, up 68.9% from Q2FY19. The Company added 2,459 Active Merchants to the platform during the September Quarter followed by 214,611 number of Active Customers during the third quarter of FY19.
.png)
Q3FY19 Operational Highlights (Source: Company Reports)
Stock Recommendation: The stock of SZL is quoting at $2.010 with a market capitalization ~$315.14 million. The stock has generated a negative return of 21.33% and 31.40% in the last one months and three months, respectively. The stock is quoting close to the average price of its 52-week trading range of $1.170 and $2.860. The Company continues to see strong commercial opportunities in the North American market. Considering the current trading levels, price movement and business prospects, we recommend a ‘Hold’ rating on the stock at the current market price of $2.010 per share, up 13.559% as on 17 January 2020, on account of receiving California lending license.
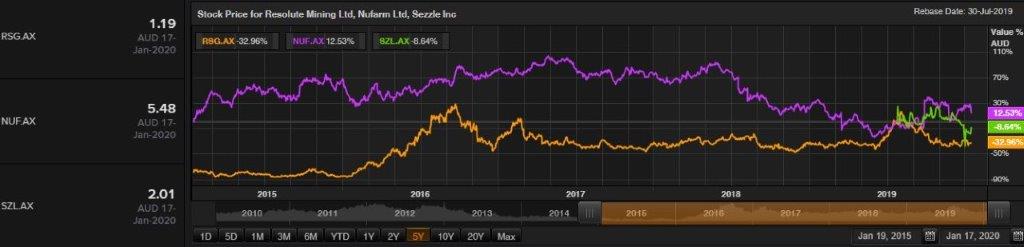
Comparative Price Chart (Source: Thomson Reuters)
Disclaimer
The advice given by Kalkine Pty Ltd and provided on this website is general information only and it does not take into account your investment objectives, financial situation or needs. You should therefore consider whether the advice is appropriate to your investment objectives, financial situation and needs before acting upon it. You should seek advice from a financial adviser, stockbroker or other professional (including taxation and legal advice) as necessary before acting on any advice. Not all investments are appropriate for all people. Kalkine.com.au and associated pages are published by Kalkine Pty Ltd ABN 34 154 808 312 (Australian Financial Services License Number 425376). The information on this website has been prepared from a wide variety of sources, which Kalkine Pty Ltd, to the best of its knowledge and belief, considers accurate. You should make your own enquiries about any investments and we strongly suggest you seek advice before acting upon any recommendation. Kalkine Pty Ltd has made every effort to ensure the reliability of information contained in its newsletters and websites. All information represents our views at the date of publication and may change without notice. To the extent permitted by law, Kalkine Pty Ltd excludes all liability for any loss or damage arising from the use of this website and any information published (including any indirect or consequential loss, any data loss or data corruption). If the law prohibits this exclusion, Kalkine Pty Ltd hereby limits its liability, to the extent permitted by law to the resupply of services. There may be a product disclosure statement or other offer document for the securities and financial products we write about in Kalkine Reports. You should obtain a copy of the product disclosure statement or offer document before making any decision about whether to acquire the security or product. The link to our Terms & Conditions has been provided please go through them and also have a read of the Financial Services Guide. On the date of publishing this report (mentioned on the website), employees and/or associates of Kalkine Pty Ltd do not hold positions in any of the stocks covered on the website. These stocks can change any time and readers of the reports should not consider these stocks as advice or recommendations.
 AU
AU

 Please wait processing your request...