
Stocks’ Details
St Barbara Limited
St Barbara Limited Earn-In and Joint Venture Agreement: St Barbara Limited (ASX: SBM) is engaged in mining and selling of gold, mineral exploration and development. The company has recently notified Australian Potash Limited of completion of its First Earn-in Period expenditure commitment of $1.75 million pursuant to the Lake Wells Gold Project Earn-in and Joint Venture Agreement. The company will now proceed to the Second Earn-in Period which will require an additional expenditure of $3.5 million to earn up to a 70% participating interest. The company in its another release has announced the appointment of Mr. Craig Jetson as MD & CEO.
For the quarter ended 30 September 2019, consolidated gold production increased to 87,569 ounces from 86,197 ounces in June 201919 quarter with AISC (All-in sustaining costs) of $1,421 per ounce, up from $1,219 per ounce in Q419.
.png)
Quarterly AISC and Gold Production (Source: Company Reports)
What to Expect from SBM: The company has revised its FY20 guidance and expects its gold production for Gwalia to be between 175,000 and 190,000 ounces at an AISC of between $1,390 and $1,450 per ounce. It also anticipates sustaining capital expenditure for Gwalia to be in the range of $60 million to $65 million and capex of between $32 million to $38 million. Simberi gold production is unchanged and is expected to be between 110,000 and 125,000 ounces at an AISC of between A$1,285 and A$1,450 per ounce. The company has also increased its expectation for its exploration expenditure and anticipates it to be between $31 million to $41 million.
Valuation Methodology: EV/Sales Multiple Approach
.png)
EV/Sales Multiple Approach (Source: Thomson Reuters)
Note: All the forecasted figures are taken from Thomson Reuters, NTM: Next Twelve Months
Stock Recommendation: As per ASX, the stock gave a return of 9.27% in the past one month and is trading close to its 52-weeks’ low level of $2.430, offering a decent opportunity for accumulation. Over the period of FY15 to FY19, the company witnessed a CAGR of 11.73% in gross profit. During FY19, net margin of the company stood at 21.8%, higher than the industry median of 10.9%. Return on Equity stood at 15% as compared to the industry median of 12%. Considering the returns, trading levels, CAGR in gross profit and margin scenario, we have valued the stock using a relative valuation method, i.e., EV/Sales Multiple Approach and arrived at a target upside of lower-double-digit (in percentage terms). Hence, we recommend a “Buy” rating on the stock at the current market price of $2.720, up by 0.369% on January 13, 2020.
Integrated Research Limited
Outstripped $100 million Revenue Mark: Integrated Research Limited (ASX: IRI) is engaged in designing, development, implementation and sale of systems and applications management computer software for business-critical computing, unified Communication networks and Payment networks. In the recently held AGM, the Management stated that the company has achieved record results and has surpassed the milestones of $100 million revenue and $20 million profit. During FY19, profit after tax increased by 14% to $21.9 million and revenue witnessed a rise of 11% to $100.8 million. This was mainly due to a strong performance in new licence sales, which grew by 19% to $62.8 million. The company also reported a strong balance sheet with total cash of $9.3 million and no debt.
.png)
FY19 Financial Performance (Source: Company Reports)
Growth Opportunities: The company is in the early stages of preparing its half-year financial statements and expects profit after tax to be in the range of $11.5 million to $12.0 million. It also anticipates its revenue to lie between $52.5 million to $53.5 million, representing 4% to 6% growth over the comparable prior period. The company also gave guidance for its license sales and expects it to be between the range of $32.5 million to $33.5 million, representing an increase of 4% to 7%. This is mainly due to the company’s unified communications product line and the persistent growth in the Asia-Pacific operation.
Valuation Methodology: EV/Sales Multiple Approach
.png)
EV/Sales Multiple Approach (Source: Thomson Reuters)
Note: All the forecasted figures are taken from Thomson Reuters, NTM: Next Twelve Months
Stock Recommendation: As per ASX, the stock of IRI gave a return of 5.59% in the past 3 months. During FY19, return on Equity stood at 34.2%, higher than the industry median of 12.6%. In the same time span, net margin of the company stood at 21.7% as compared to the industry median of 15.1%. This indicates that the company is managing its costs well and is capable of converting its revenue into profits. Considering the returns, positive outlook and higher ROE, we have valued the stock using EV/Sales relative valuation approach and have arrived at a target upside of lower single-digit (in percentage terms). For the said purposes, we have considered TechnologyOne Ltd (ASX: TNE), FINEOS Corporation Holdings PLC (ASX: FCL), Infomedia Ltd (ASX: IFM) and Gentrack Group Ltd (ASX: GTK) as peers. Hence, we recommend a “Hold” rating on the stock at the current market price of $3.160, down 1.558% as on 13 January 2020.
Image Resources NL
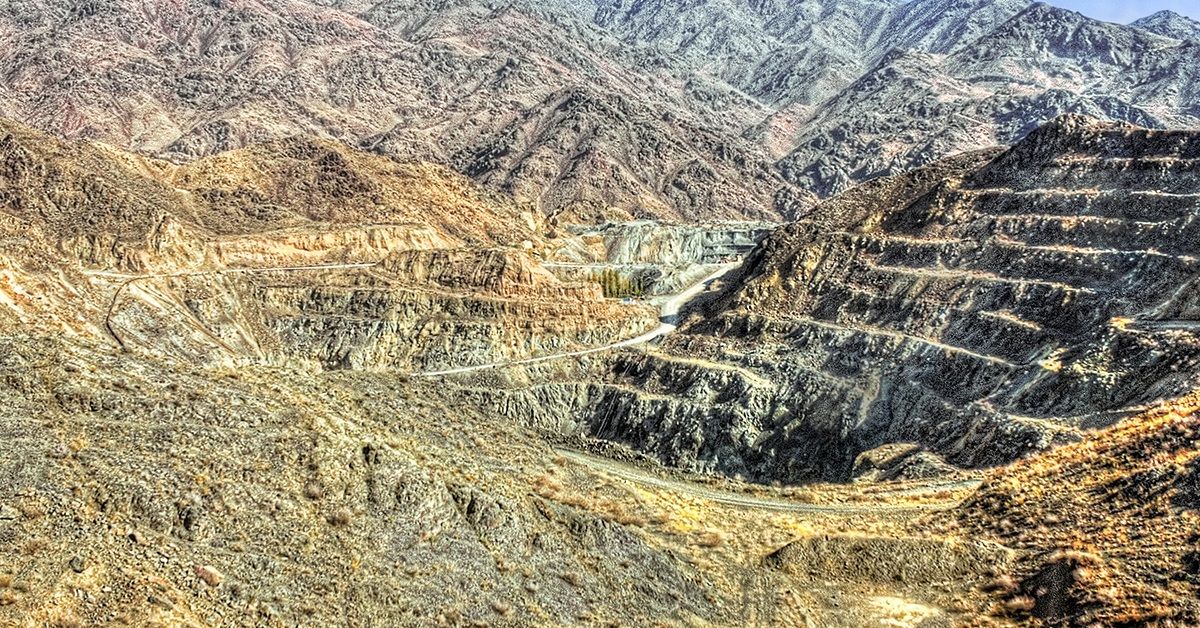
Strong Operating Margins: Image Resources NL (ASX: IMA) is an emerging mineral sand producer. As on 13 January 2020, the market capitalization of the company stood at $215.82 million. The company has recently given an update on Ore Reserves and stated that it has resulted in an increase of 24% in the total heavy minerals ore grade and a 50% increase in the in-situ zircon grade. The company has recently released its quarterly report, wherein the HMC production stood at 66.3kt for the quarter ended 30 September 2019. The company also reported strong operating margins with operating cash flow of $13.1 million and a cash position of $35.8 million. For the same time span, finished HMC inventory was 46kt DMT with an estimated sales value of $32 million. The company will release its quarterly update of December later in January.
.png)
FY19 Statistics (Source: Company Reports)
What to Expect from IMA: The company has recently updated its production guidance as per which its HMC production in CY2020 is expected to be in the range of 300-330kt. It will also seek to build upon its operational successes by prioritizing the addition of new ore reserves from existing and new mineral resources.
Stock Recommendation: As per ASX, the stock of IMA gave a negative return of 10.2% in the past one month. The stock is inclined towards its 52-weeks’ high level of $0.305. During FY19, net margin was in-line with the industry median and stood at 10.3%. During the year, Return on Equity was 11.3%, higher than the industry median of 5.4%. Considering the returns, trading levels, high ROE and decent outlook, we recommend a watch stance on the stock at the current market price of $0.235, up by 6.818% on 13 January 2020, owing to guidance update.
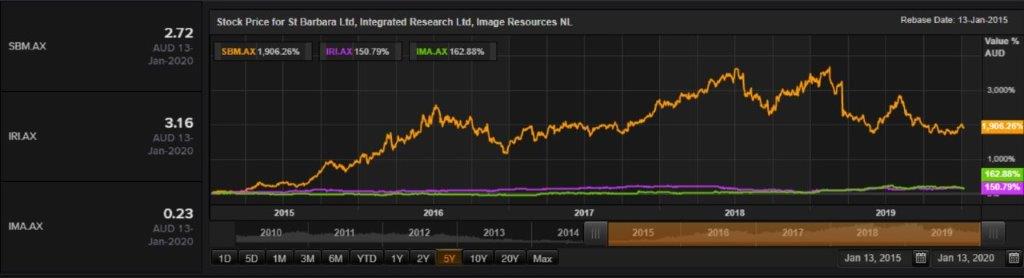
Comparative Price Chart (Source: Thomson Reuters)
Disclaimer
The advice given by Kalkine Pty Ltd and provided on this website is general information only and it does not take into account your investment objectives, financial situation or needs. You should therefore consider whether the advice is appropriate to your investment objectives, financial situation and needs before acting upon it. You should seek advice from a financial adviser, stockbroker or other professional (including taxation and legal advice) as necessary before acting on any advice. Not all investments are appropriate for all people. Kalkine.com.au and associated pages are published by Kalkine Pty Ltd ABN 34 154 808 312 (Australian Financial Services License Number 425376). The information on this website has been prepared from a wide variety of sources, which Kalkine Pty Ltd, to the best of its knowledge and belief, considers accurate. You should make your own enquiries about any investments and we strongly suggest you seek advice before acting upon any recommendation. Kalkine Pty Ltd has made every effort to ensure the reliability of information contained in its newsletters and websites. All information represents our views at the date of publication and may change without notice. To the extent permitted by law, Kalkine Pty Ltd excludes all liability for any loss or damage arising from the use of this website and any information published (including any indirect or consequential loss, any data loss or data corruption). If the law prohibits this exclusion, Kalkine Pty Ltd hereby limits its liability, to the extent permitted by law to the resupply of services. There may be a product disclosure statement or other offer document for the securities and financial products we write about in Kalkine Reports. You should obtain a copy of the product disclosure statement or offer document before making any decision about whether to acquire the security or product. The link to our Terms & Conditions has been provided please go through them and also have a read of the Financial Services Guide. On the date of publishing this report (mentioned on the website), employees and/or associates of Kalkine Pty Ltd do not hold positions in any of the stocks covered on the website. These stocks can change any time and readers of the reports should not consider these stocks as advice or recommendations.
 AU
AU
 Please wait processing your request...