
Stocks’ Details
CIMIC Group Limited
CIMIC Group’s UGL Secures Mining Contract Worth $180 Mn:CIMIC Group Limited (ASX: CIM) is engaged in providing mining, engineering-led construction, along with operation and maintenance services to the infrastructure sector. On 22nd January 2020, the company stated that its UGL group has secured mining contracts for a collective revenue of roughly $180 million, to be executed over a period of three years. The move will help the company to offer maintenance and project related services to its customers.
Other Recent Updates:Recently, the company stated that Trevor Gerber has ceased to be a Director in the company, effective from 31st December 2019. In another update, the company noted that its 50:50 investment partner, Ventia, has inked an agreement with Ferrovial S.A. to acquire Broadspectrum, subject to regulatory approvals. The acquisition will be completed in 2020 and the combined group is likely to generate revenue of more than $5 billion.
9MFY19 Financial Highlights for the Period Ended 30 September 2019: The company reported revenue of $10.7 billion, flat on a year over year basis. NPAT of the company came in at $573 million as compared to $563 million in 9MFY18.Operating cash flow for 9MFY19 stood at $810.6 million. The company exited the period with net cash balance of $826.3 million.
.PNG)
9MFY19 Revenue & NPAT highlights (Source: Company Reports)
Outlook:The company expects NPAT for 2019 to be in the range of $790 million to $840 million. The company remains focused on delivering shareholder returns and expects continued growth from the mining segment.
Valuation Methodology: P/E Multiple Approach
.png)
P/EBased Valuation (Source: Thomson Reuters)
Note: All forecasted figures and peers have been taken from Thomson Reuters, NTM-Next Twelve Months
Stock Recommendation: As per ASX, the stock is trading below the average of its 52-week low and high of $28.880 and $51.50, respectively. The stock gave a return of 6.71% in the past three months. As per ASX, the stock has a market cap of $11.12 billion with a PE multiple of 14.2x and an annual dividend yield of 4.57%, suggesting a decent opportunity for accumulation. We have valued the stock using P/E based relative valuation method, and for the said purpose, we have considered peers like Downer EDI Ltd (ASX: DOW), Worley Ltd (ASX: WOR) and Boral Ltd (ASX: BLD), to name few. Therefore, we have arrived at a target price with an upside of lower double-digit (in percentage terms). Considering the above factors, we give a “Hold” recommendation on the stock at the current market price of $34.98 per share, up 1.864% on 22nd January 2020.
Bank of Queensland Limited
BOQ Raises $250 Mn in SSP, Strengthens Balance Sheet: Bank of Queensland Limited (ASX: BOQ) is one of the top regional banks with over 180 branches across Australia. Recently, the company stated the change of Director’s interest, wherein one of its Directors named Bruce James Carteracquired 4,127 Ordinary Shares, pursuant to the Share Purchase Plan, for a consideration of $7.27 per share.
Successful Completion of Capital Raising: On 30th December 2019, the company stated the completion of the Share Purchase Plan, which was announced in combination with BOQ’s fully underwritten $250 million institutional placement. The company raised ~$89.7 million and intends to use the amount to improve its financial strength.
FY19 Financial Key Highlights: The company’s statutory net profit after tax and cash earnings after tax declined by 11% and 14%, respectively, on a year over year basis. For FY19, the company declared a dividend of 65 cents per share, which declined 14% as compared to pcp.
.png)
FY19 Results Outline (Source: Company Reports)
What to Expect: For FY20, the company expects a difficult year with lower year-on-year cash earnings, higher post-Hayne regulatory and compliance costs. In FY20, the company also expects to incur increased operating expenses due to higher investment in technology.
Valuation Methodology: P/CF Multiple Approach
.png)
P/CFBased Valuation (Source: Thomson Reuters)
Note: All forecasted figures and peers have been taken from Thomson Reuters, NTM-Next Twelve Months
Stock Recommendation: As per ASX, the stock is trading below the average of its 52-week low and high of $7.11 and $10.77, respectively. As per ASX, the stock has a market cap of $3.33 billion with a PE multiple of 9.88x and an annual dividend yield of 8.87%, suggesting a decent opportunity for accumulation. We have valued the stock using P/CF based relative valuation method, and for the said purpose, we have considered peers like Bendigo and Adelaide Bank Ltd (ASX: BEN), Westpac Banking Corp (ASX: WBC) and Australia and New Zealand Banking Group Ltd (ASX: ANZ), to name few. Therefore, we have arrived at a target price with an upside of lower double-digit (in percentage terms). Considering the favourable valuation and current trading levels, we give a “Buy” recommendation on the stock at the current market price of $7.400 per share, up 0.955% on 22nd January 2020.
Wesfarmers Limited
Revenues Up ~4% Year Over Year in FY19: Wesfarmers Limited (ASX: WES) is involved in the business of diversified industrials, which incorporates retail operations covering home development and office supplies, gas processing and distribution, general merchandise and specialty departments stores, chemicals and fertilisers, etc. The company notified that H1FY20 results will be announced on 19 February 2020.
Managerial Changes: On 20th January 2019, the company announced that Aleksandra Spaseska, Company Secretary of the company has stepped down from the post, effective from 2 March 2020, to take up the role of CFO in Kmart Group.
FY19 Financial Highlights: The company reported net profit after tax of $1.9 billion in FY19, an increase of 13.5% on a year over year basis. The company reported revenue of $27.9 billion in FY19, up 4.3% on a year over year basis. The company declared a full-year dividend of $2.78 per share, including $1 as a special dividend.
.png)
FY19 Financial Highlights (Source: Company Reports)
What to Expect: The company remains confident about the outlook for the group and is optimistic that the improvements in customer offers and new growth platforms are likely to provide higher value to shareholders. It also anticipates that earnings will be impacted by ongoing investment in maintaining price leadership as well as higher team member wages, post execution of the new enterprise agreement.
Stock Recommendation: As per ASX, the stock is trading close to its 52-week high of $44.900. The stock gave a return of 38.64% in the past one year. As per ASX, the stock has a market cap of $49.99 billion with a PE multiple of 9.05x and an annual dividend yield of 4.04%. Net margin of the company stood at 6.9% in FY19, higher than the FY18 net margin of 5.3%. In FY19, the company’s debt to equity stood at 0.30x, lower than the industry median of 0.67x. The company will be releasing the results for 1HFY20 soon. Considering the performance in FY19, decent outlook, and current trading levels, we have a watch stance on the stock at the current market price of $44.77 per share, up 1.542% on 22nd January 2020.
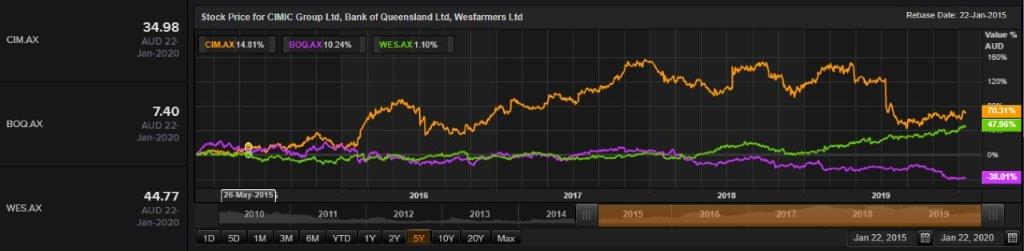
Comparative Price Chart (Source: Thomson Reuters)
Disclaimer
The advice given by Kalkine Pty Ltd and provided on this website is general information only and it does not take into account your investment objectives, financial situation or needs. You should therefore consider whether the advice is appropriate to your investment objectives, financial situation and needs before acting upon it. You should seek advice from a financial adviser, stockbroker or other professional (including taxation and legal advice) as necessary before acting on any advice. Not all investments are appropriate for all people. Kalkine.com.au and associated pages are published by Kalkine Pty Ltd ABN 34 154 808 312 (Australian Financial Services License Number 425376). The information on this website has been prepared from a wide variety of sources, which Kalkine Pty Ltd, to the best of its knowledge and belief, considers accurate. You should make your own enquiries about any investments and we strongly suggest you seek advice before acting upon any recommendation. Kalkine Pty Ltd has made every effort to ensure the reliability of information contained in its newsletters and websites. All information represents our views at the date of publication and may change without notice. To the extent permitted by law, Kalkine Pty Ltd excludes all liability for any loss or damage arising from the use of this website and any information published (including any indirect or consequential loss, any data loss or data corruption). If the law prohibits this exclusion, Kalkine Pty Ltd hereby limits its liability, to the extent permitted by law to the resupply of services. There may be a product disclosure statement or other offer document for the securities and financial products we write about in Kalkine Reports. You should obtain a copy of the product disclosure statement or offer document before making any decision about whether to acquire the security or product. The link to our Terms & Conditions has been provided please go through them and also have a read of the Financial Services Guide. On the date of publishing this report (mentioned on the website), employees and/or associates of Kalkine Pty Ltd do not hold positions in any of the stocks covered on the website. These stocks can change any time and readers of the reports should not consider these stocks as advice or recommendations.
 AU
AU

 Please wait processing your request...