.png)
Stocks’ Details (Data from ASX)
WAM Capital Limited
Investment Portfolio’s Performance Helped Operating Profit: WAM Capital Limited (ASX: WAM) ended FY 2018 as at June 30, 2018 with operating profit amounting to $166.9 million (before tax) reflecting the YoY growth of 87.6%. This growth momentum was well-supported by robust performance of the company’s investment portfolio. The company is analysed with the help of three pillars namely: Investment portfolio performance, growth of NTA as well as total shareholder return or TSR. The investment portfolio of WAM Capital rose 15.0% in the year ended June 30, 2018 which has outperformed the performance of S&P/ASX All Ordinaries Accumulation Index by a decent margin. This index witnessed an increase by 13.7%.
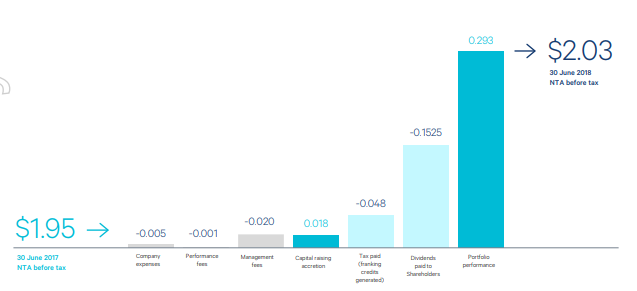
Performance of NTA before tax of WAM Capital (Source: Company Reports)
NTA (Net tangible asset) of WAM Capital before tax witnessed the rise of 12% for the year ended June 30, 2018. Finally, WAM Capital’s total shareholder return or TSR stood at 6.1% for the twelve months ended on June 30, 2018.
Quick Look at WAM Capital’s Portfolio Performance in September: The investment portfolio of WAM Capital witnessed the rise of 0.1% in the month of September 2018. In the same month, Scottish Pacific Group (ASX: SCO), which happens to be in the company’s top 20 holdings, has made an announcement that Affinity Equity Partners decided to advance over $600 million in order to acquire it. The company’s shares ended on positive note for September 2018.
Robust Investment Activities to Shape WAM’s Future: The management of WAM stated that it would continue to make investments mainly into the stocks which are listed on ASX in order to meet the broader objectives of the company. Needless to say, the future of WAM would be highly sensitive to the investment performance which would be affected by the investee company. To be more precise, the factors as well as industry conditions to which investee companies are sensitive. Apart from these factors, the macro-economic conditions (like exchanges as well as interest rates) would continue to impact the performance while WAM is withholding a resilient position.
Stock analysis: Relative Strength Index or RSI has been applied on the daily chart of WAM Capital Limited by using the default values. As per the observation, 14-day RSI is moving downwards and soon would be in the oversold region after which we can expect a rebound leading to a bullish momentum.
Therefore, we maintain “Hold” rating on WAM at the current price of A$2.410.
Magellan Global Trust
Quick Overview of NII and Cash Flows: From August 11, 2017 to June 30, 2018, Magellan Global Trust (ASX: MGG) generated total net investment income amounting to $195.8 million. The factors which help the investment income are dividend and distribution income, interest income, net gains or losses with regard to foreign exchange settlements as well as net change witnessed in the investments’ fair value. During the same period, the company managed net cash inflow amounting to $0.307 million from the operations which was mainly aided by the dividends as well as distributions received.
From August 11, 2017 to June 30, 2018, MGG saw net cash outflows amounting to $1.1 billion with respect to the investing activities. The company has purchased large number of investments in the mentioned time frame.
Downturn in IT stocks to impact Magellan Moving Forward: As per the fund update for September 2018, amongst Magellan Global Trust’s top 10 holdings, the top 2 holdings are in the giants of the technology sector i.e. Alphabet Inc. and Facebook. However, it has holdings in Visa Inc. and Mastercard Inc. as well. Therefore, it would not be wrong to say that the performance moving forward would highly be dependent upon the technology sector. Any negative impact in this sector could, in turn, impact the Trust’s performance.

Exposure and Holdings (Source: Company Reports)
The management of the company stated that its operations would be sensitive to the variety of factors which include the fluctuations in the investment markets.
Stock analysis: Moving Average Convergence Divergence or MACD has been applied on the daily chart of MGG by considering the default values. As per the observation, the MACD line has crossed the signal line and is moving downwards creating the buy opportunity because of the positive outlook and exposure to the tech stocks which may be on a revival mode post market stability.
If the market rallies the tech heavyweights would be witnessing a robust momentum which would help the stock price of MGG. Therefore, we give a “Buy” rating on the stock at the current price of A$1.615.
Transurban Group
Traffic Growth Helped TCL’s Toll Revenues: Transurban Group (ASX: TCL) ended FY 2018 by witnessing the positive momentum in the key parameters of the company. It generated toll revenues amounting to $2.2 billion in FY 2018 representing a decent growth on the YoY basis. This was strongly supported by traffic growth as well as increased prices of the toll. However, marginal contribution was also witnessed from A25.
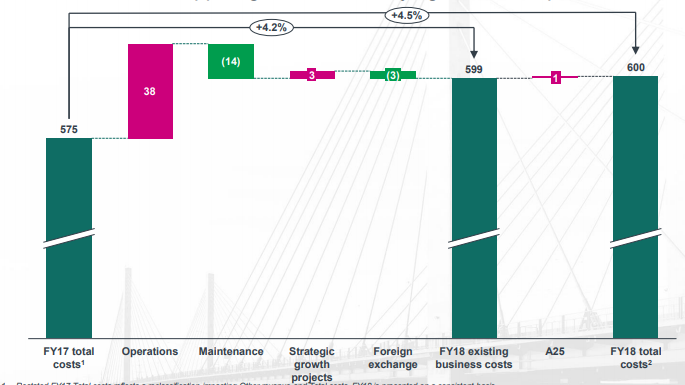
TCL’s cost movement (Source: Company Reports)
The company generated EBITDA amounting to $1.6 billion in FY 2018 and the YoY increase was underpinned by the growth witnessed in the toll revenues. In the same period, the company’s net profit stood at $468 million. As per the management of the company, the increased costs were witnessed primarily because of the growth initiatives with regards to the business operations. The company’s management stated that it has maintained a mix of debt/equity funding which could help the company’s credit metrics.
Increased digital initiatives to Help Transurban Group: The management of Transurban Group would be making deployments towards the digital initiatives which would also improve the customers’ experience. The company is well-positioned to move ahead and fund the existing pipelines because of the strong balance sheet position that it is currently enjoying. Moreover, with increased digital tools, the company could attract the attention of the market players.
As per the management, there are substantial untapped opportunities available in North America as well as Australia. Tapping them could improve the fundamentals of the business. The company is working to expand the customer service channels.
Stock Analysis: On the daily chart of Transurban Group, MACD (Moving Average Convergence Divergence) indicator has been applied by taking into account the default values. After careful observation, it was noticed that MACD line has crossed the signal line and is moving upwards representing a bullish momentum.
Given the strong fundamentals, pipeline of projects, and support from toll revenue and population enhancement, we maintain a “Buy” rating on the stock at the present market price of A$11.120.
.png)
Comparative Dividend Yield and EPS (Source: Thomson Reuters)
Disclaimer
The advice given by Kalkine Pty Ltd and provided on this website is general information only and it does not take into account your investment objectives, financial situation or needs. You should therefore consider whether the advice is appropriate to your investment objectives, financial situation and needs before acting upon it. You should seek advice from a financial adviser, stockbroker or other professional (including taxation and legal advice) as necessary before acting on any advice. Not all investments are appropriate for all people. Kalkine.com.au and associated pages are published by Kalkine Pty Ltd ABN 34 154 808 312 (Australian Financial Services License Number 425376). The information on this website has been prepared from a wide variety of sources, which Kalkine Pty Ltd, to the best of its knowledge and belief, considers accurate. You should make your own enquiries about any investments and we strongly suggest you seek advice before acting upon any recommendation. Kalkine Pty Ltd has made every effort to ensure the reliability of information contained in its newsletters and websites. All information represents our views at the date of publication and may change without notice. To the extent permitted by law, Kalkine Pty Ltd excludes all liability for any loss or damage arising from the use of this website and any information published (including any indirect or consequential loss, any data loss or data corruption). If the law prohibits this exclusion, Kalkine Pty Ltd hereby limits its liability, to the extent permitted by law to the resupply of services. There may be a product disclosure statement or other offer document for the securities and financial products we write about in Kalkine Reports. You should obtain a copy of the product disclosure statement or offer document before making any decision about whether to acquire the security or product. The link to our Terms & Conditions has been provided please go through them and also have a read of the Financial Services Guide. On the date of publishing this report (mentioned on the website), employees and/or associates of Kalkine Pty Ltd do not hold positions in any of the stocks covered on the website. These stocks can change any time and readers of the reports should not consider these stocks as advice or recommendations.
 AU
AU

 Please wait processing your request...