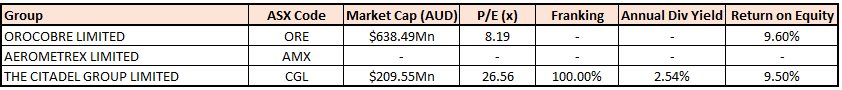
Stocks’ Details
Orocobre Limited
Li Sales for Sep Qtr Improved by 45% on PCP: Dynamic global lithium carbonate supplier, Orocobre Limited (ASX: ORE) is involved in the exploration, development and production of lithium at its flagship Olaroz lithium facility.
September Quarter 2019 Highlights: Revenue for the quarter came in at US$22.1 million, down 21% sequentially. Sales quantity for the period also increased by 45% on pcp. Average price received fell by 52% on pcp. Gross cash margin for September quarter of 2019 (excluding export tax) was 78% down pcp. The September quarter of 2019 saw Borax delivering another good performance with sales volume of 12,480 tonnes, up 33% on pcp. Sales revenue was the same on qoq basis with the average price received down 6% on qoq basis due to the product mix. The company’s balance sheet remained strong, with a cash balance of US$223.5 million.
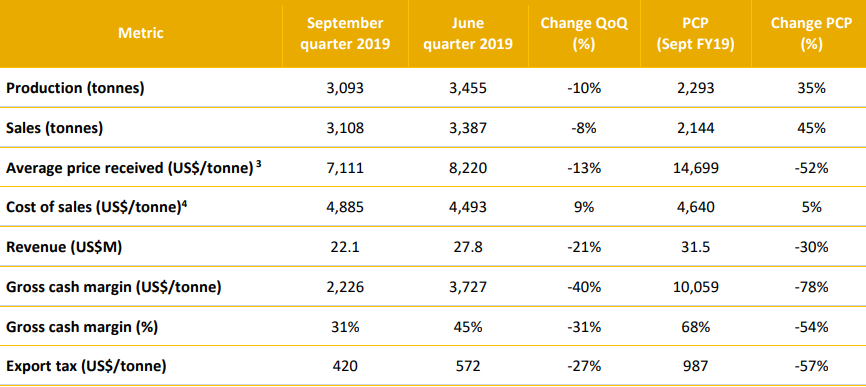
September Quarter Key Operational Metrics (Source: Company Reports)
What to expect:The indicative weighted average price of lithium carbonate sales for the December quarter has been estimated at US$5,400/tonne FOB, subject to achieving the planned shipping schedule. Lithium chemical prices are well below incentive pricing for green-fields projects but are expected to recover in the medium term. Whilst company has decreased its price guidance for the quarter, operational and cost improvements are expected to limit the impact on its operating margin.
Full-year FY20 production is expected to be at least 5% higher than FY19. For 2QFY20, the company expects average sales price to be in the range of US$6,200-6,500/tonne.
Valuation Methodology: Price to Book Value Multiple Approach
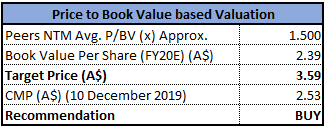
Price to Book Value Multiple Approach (Source: Thomson Reuters)
Note: All forecasted figures and peers have been taken from Thomson Reuters, *NTM-Next Twelve Months
Stock Recommendation:ORE’s share generated negative YTD return of 23.03%. Its gross margin and net margin for FY19 stood at 45.2% and 67.3%, better than the industry median of 38.9% and 11.4%, respectively, implying decent fundamental of the company. Its current ratio for FY19 stood at 3.27x, better than the industry median of 1.81x. Despite weakness in the market, company’s strong business model and balance sheet provide an impetus on reducing the cost of production maintaining its position as one of the lowest cost producers of lithium chemicals. Considering the aforesaid facts and current trading levels, we have valued the stock using a relative valuation method, i.e., Price to Book Value multiple, and arrived at a double-digit growth (in % terms). Hence, we recommend a “Buy” rating on the stock at the current market price of $2.530, up 3.689% on December 10, 2019.
Aerometrex Limited
Aerometrex Shares Commenced Trading on ASX:Aerometrex Limited (ASX: AMX) is a leading practitioner of aerial imaging, photogrammetry, 3D modelling and LiDAR surveys. Recently, the stock was listed on ASX and has commenced trading on December 10, 2019. The company has continued to grow strongly in-line with past growth metrics during the financial year to date, which is evident from the growth across its four operating divisions, i.e., Aerial photo-contracting, MetroMap, LiDAR and 3D modelling.
Top 10 Shareholders:The top 10 shareholders comprise ~69.87% of the total shareholding. 199 Investment Pty Ltd and Deuter family are the top 2 shareholders in the company with a holding of 12.83% and 12.03%, respectively.
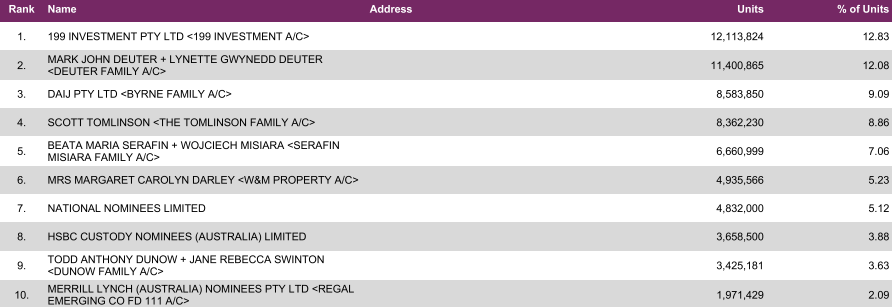
Top 10 Shareholders (Source: Company Reports)
FY19 Key Financial Highlights:Revenue for the period increased from $13,129,000 in FY18 to $16,109,000 in FY19. Profit for the year after income tax was reported at $2,570,000 as compared to $1,828,000 in the previous year. Company’s cash balance at the end of the period was reported at $5,110,000 as compared to $974,000 a year before. Its trade receivables and trade payables for the period were reported at $2,759,000 and $1,103,000, respectively, as compared to $2,860,000 and $464,000 in the previous year.
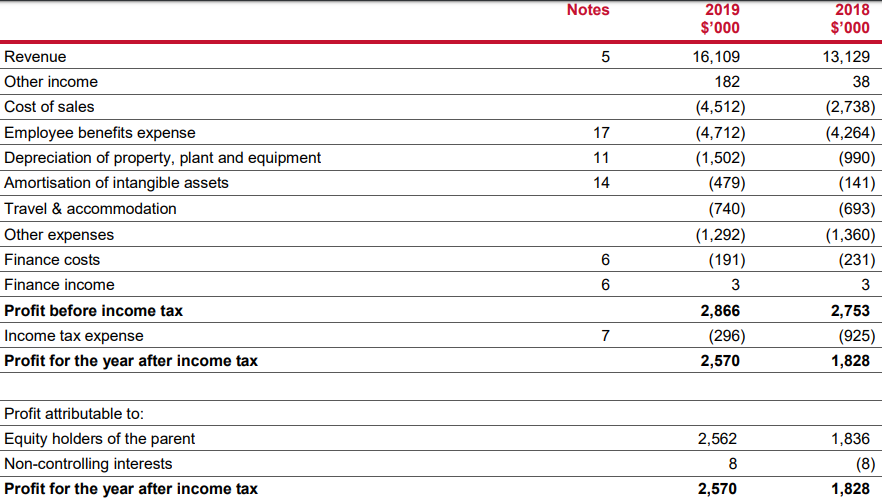
FY19 Income Statement (Source: Company Reports)
What to Expect:AMX has continued to attract new subscribers to its MetroMap service, including clients in local government, recreation, solar installation, a major airport quarries, traffic management, urban planning, surveying, construction and engineering.Major capital city coverages have been completed in Brisbane, Melbourne, Adelaide and Perth, however smoke from the recent bushfires in New South Wales and Queensland has prevented some capture programs proceeding as planned. The regional coverage of the MetroMap image database continues to expand rapidly. New surveys have been flown in Dubbo, Mackay, Rockhampton, Yeppoon, Townsville, Gold Coast, Sunshine Coast and Ballarat. The MetroMap web browser interface is continuing technical development and now includes the facility to switch to a full 3D display within the same browser panel where these 7.5 cm 3D models exist.
Stock Recommendation:Listing of stock is an important milestone for the company as the business now has the balance sheet to pursue the numerous growth initiatives in its development plan. Considering the recent listing on ASX, FY19 financial performance, key business developments and projects, we have a watch view on the stock at the current market price of $1.835 on December 10, 2019.
The Citadel Group Limited
Cash Balance at the end of FY19 Stood at $14 Mn:The Citadel Group Limited (ASX: CGL) is involved in the provision of software and services, product sales and installation, and consulting and professional services in the technology sector throughout Australia. Recently, company’s director Mark McConnell acquired 51,530 ordinary shares.
FY19 Key Highlights for the period ended June 30, 2019: Total revenue from continuing operations stood at $99.2 Mn as compared to $106.5 Mn in FY18. Gross profit for the company decreased from $55.5 Mn in FY18 to $45.0 Mn in FY19. Net Profit After Tax (NPAT) from continuing operations for the period was reported at $10.9 Mn as compared to $19.4 Mn in FY18. Cash and cash equivalents as on June 30, 2019 stood at $14.0 Mn as compared to $24.9 Mn as on June 30, 2018. The Board of Directors declared a fully franked final dividend of 6.0 cents per share, with record date and payment date on August 24, 2019 and September 27, 2019, respectively.
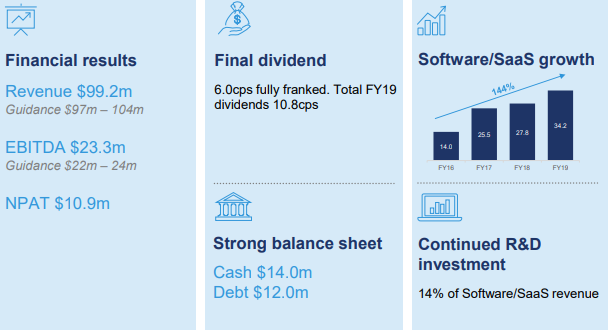
FY19 Key Metrics (Source: Company Reports)
What to Expect: The company is executing well on the Citadel 2.0 strategy, which is expected to deliver a business with a high percentage of recurring SaaS and software-based services revenue across a diverse client base, over time. Investments made by the company are expected to place it as a leading provider of secure enterprise information management in Australia. With availability of several opportunities in Australia and globally, the company is looking forward to organic growth along with value addition through strategic mergers and acquisitions.
Valuation Methodology: Price to Earnings (PE) Multiple Approach
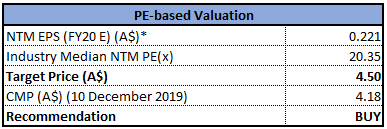
Price to Earnings (PE) Multiple Approach (Source: Thomson Reuters)
Note: All forecasted figures and peers have been taken from Thomson Reuters, *NTM-Next Twelve Months
Stock Recommendation: The stock generated a negative YTD return of 40.81%. The stock is currently trading at the lower band of its 52-week trading range of $2.940 - $8.900. Its debt to equity multiple for FY19 stood at 0.15x, lower than the industry median of 0.56x. Considering the development in SaaS business, Citadel 2.0 products gaining traction, new contract wins, international opportunities and current trading levels, we have valued the stock using a relative valuation method, i.e., Price to Earnings (PE) multiple and arrived at a single digit growth (in %). Hence, we recommend a “Buy” rating on the stock at the current market price of $4.180, down 1.647% on December 10, 2019.
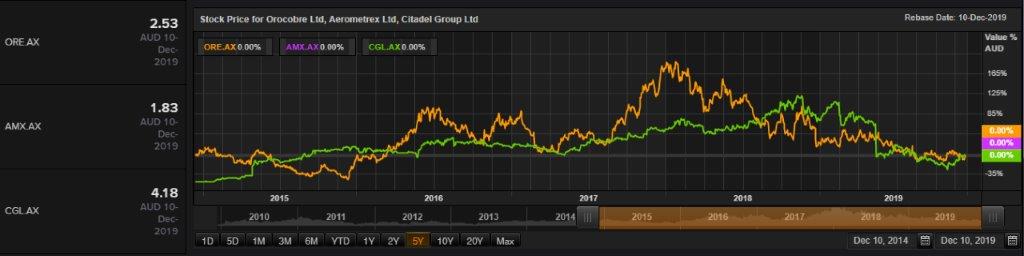
Comparative Price Chart (Source: Thomson Reuters)
Disclaimer
The advice given by Kalkine Pty Ltd and provided on this website is general information only and it does not take into account your investment objectives, financial situation or needs. You should therefore consider whether the advice is appropriate to your investment objectives, financial situation and needs before acting upon it. You should seek advice from a financial adviser, stockbroker or other professional (including taxation and legal advice) as necessary before acting on any advice. Not all investments are appropriate for all people. Kalkine.com.au and associated pages are published by Kalkine Pty Ltd ABN 34 154 808 312 (Australian Financial Services License Number 425376). The information on this website has been prepared from a wide variety of sources, which Kalkine Pty Ltd, to the best of its knowledge and belief, considers accurate. You should make your own enquiries about any investments and we strongly suggest you seek advice before acting upon any recommendation. Kalkine Pty Ltd has made every effort to ensure the reliability of information contained in its newsletters and websites. All information represents our views at the date of publication and may change without notice. To the extent permitted by law, Kalkine Pty Ltd excludes all liability for any loss or damage arising from the use of this website and any information published (including any indirect or consequential loss, any data loss or data corruption). If the law prohibits this exclusion, Kalkine Pty Ltd hereby limits its liability, to the extent permitted by law to the resupply of services. There may be a product disclosure statement or other offer document for the securities and financial products we write about in Kalkine Reports. You should obtain a copy of the product disclosure statement or offer document before making any decision about whether to acquire the security or product. The link to our Terms & Conditions has been provided please go through them and also have a read of the Financial Services Guide. On the date of publishing this report (mentioned on the website), employees and/or associates of Kalkine Pty Ltd do not hold positions in any of the stocks covered on the website. These stocks can change any time and readers of the reports should not consider these stocks as advice or recommendations.
 AU
AU
 Please wait processing your request...