Stocks’ Details
Evolution Mining Limited
Record Mine Operating Cash Flow in September Quarter:Evolution Mining Limited (ASX: EVN) is involved in the exploration, mine development, mine operations, and the sale of gold/copper concentrate in Australia. On October 15, 2019, the company announced its September’19 Quarter results, wherein it highlighted that its mine operating cash flow reported a Q-o-Q increase of 30%, at A$278.7 Mn.Its net mine cash flow for the period increased by 36% to A$207.4 Mn. Free cash flow for the period increased by 45% to A$158.6 Mn. Net cash position improved from A$35.2 Mn in June’19 quarter to A$91.7 Mn in September’19 quarter. During FY19, a fully franked final dividend amounting to A$102.1 Mn was paid to shareholders.
Gold production was reported at 191,967 ounces, including record production at Cowal under Evolution ownership of 75,807 ounces. All-in Sustaining Cost (AISC) for the period stood at A$1,018 per ounce.
In another update, Great Southern Mining Ltd informed the market about its partnership with Evolution mining to undertake hyperspectral surveys over Edinburgh Park and Johnnycake Projects, Queensland, where EVN will be funding 50% costs of the survey.
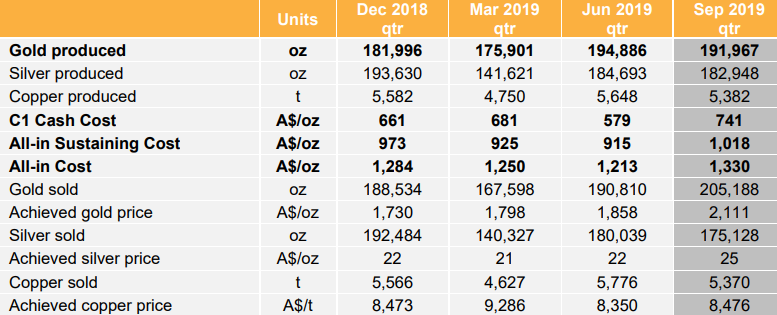
Consolidated production and sales summary (Source: Company Reports)
What to Expect:As per the release, FY20 gold production guidance stands unchanged with an expected range of 725,000 – 775,000 ounces. All-in Sustaining Cost (AISC) guidance was increased by A$50/oz to A$940 – A$990/oz. The impact of revised metal price assumptions on royalties & by-product credits led to an increase in AISC by A$20/oz. Moreover, stability issues in Mt Rawdon pit west wall requiring a revised mine plan pushed for further increase in AISC guidance by A$30/oz.
Stock Recommendation:SBM’s share generated a positive YTD return of 21.43%. Its EBITDA margin and net margin for FY19 stood at 46.7% and 14.5%, better than the industry median of 29.1% and 11.0%, respectively, implying decent fundamentals of the company. Its current ratio for FY19 stood at 2.31x, better than the industry median of 1.75x, which means that the company is in a better position to address its short-term obligations. Debt to equity multiple for FY19 stood at 0.12x, lower than the industry median of 0.13x. Considering the above factors and current trading levels,we recommend a “Buy” rating on the stock at the current market price of $4.400, down 0.452% on October 15, 2019.
Kirkland Lake Gold Ltd
Positive Drill Result at Macassa Mine in Kirkland Lake:Kirkland Lake Gold Ltd (ASX: KLA) is a gold producer, operating in Canada and Australia. Recently, the company released an announcement on its new drill results from underground exploration drilling at the Macassa Mine in Kirkland Lake, Ontario. The result stated a significant potential to grow mineral resources at Macassa to the east and west of the South Mine Complex (SMC), and in the Lower SMC.As per another update, the company notified that it paid dividends amounting to US$0.04 per common share on October 11, 2019.
Q2FY19 Key Highlights for the period ended June 30, 2019:Net earnings for the period increased by 69% to $104.2 Mn, as compared to $61.5 million in pcp. Adjusted net earnings for the period increased by 66% to $105.5 Mn. Revenue for the period stood at $281.3 Mn, up 31% on pcp.
EBITDA for the period grew by 50% to $185.8 Mn. However, it decreased by ~7.84% as compared to the previous quarter.Operating cash flow for the period was reported at $178.4 Mn, an increase of 48% on pcp and 2% on the previous quarter. Cash held at the end of the period was reported at $469.4 Mn, up 13% on the previous quarter.
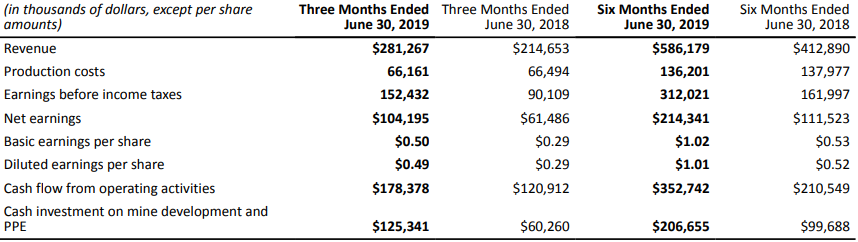
Key Financial Metrics (Source: Company Reports)
FY19 Guidance:Full-year gold production guidance range for Macassa, Holt Complex and Fosterville has been estimated at 240 – 250 kozs, 140 - 150 kozs and 570 – 610 kozs, respectively. Full year AISC/ounce sold is estimated to be between $520 - $560.Operating cash costs for the year are expected to be in the range of $290 - $300 per oz.
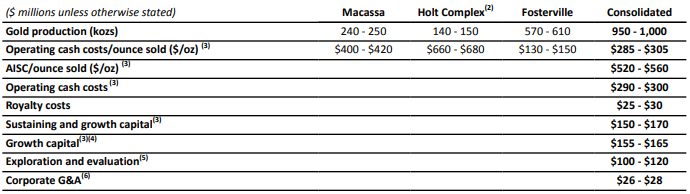
Full-Year Guidance (Source: Company Reports)
Stock Recommendation:KLA’s stock generated positive YTD returns of 71.43%. Its gross margin, EBITDA margin and net margin for Q2FY19 stood at 62.3%, 67.5% and 37%, better than the industry medians of 38.7%, 26.2% and 5.1%, respectively. Its current ratio for Q2FY19 stood at 2.03x, lower than the industry median of 2.36x. Currently, the stock is trading towards its 52-week high level of $81.00. Considering theaforesaid facts and current trading level, we recommend an “Expensive” rating on the stock at the current market price of $66.390, up 0.591% on October 15, 2019.
BlueScope Steel Limited
FY19 Sales Revenue Increased by 9%, yoy:BlueScope Steel Limited (ASX: BSL) is involved in the production of metal coated, and painted steel building products across the Asia-Pacific region. Recently, the Australian Competition & Consumer Commission (ACCC) informed the company that the Commonwealth Director of Public Prosecutions (CDPP) has determined not to commence criminal cartel proceedings against either BlueScope or its former employee, Mr Jason Ellis, regarding contraventions of the Australian competition cartel provisions.
With an update on October 15, 2019, the company informed the market that it bought back28,729,990shares with the consideration of $358,735,561 via on-market.
In another update, the company disclosed its financial calendar for 2020.
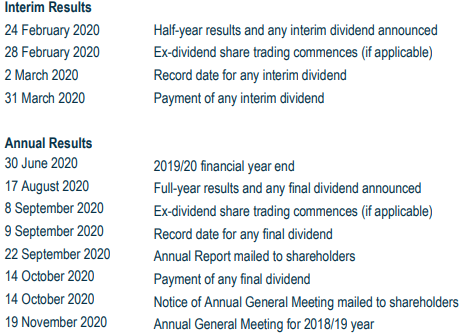
2020 Financial Calendar (Source: Company Reports)
FY19 Key Highlights for the period ended June 30, 2019:Sales revenue from continuing operations increased by 9% on pcp, to $12,532.8 Mn. Underlying EBIT for the period increased by 6% to $1,348.3 Mn, mainly due to increased global steel prices along with weaker AUD against USD.Reported net profit after tax for the period decreased by 35% to $1,015.8 Mn. Return on Invested Capital decreased from 20% in FY18 to 19.5% in FY19. Net cash improved from $63.6 Mn as at 30 June 2018 to $692.7 Mn as at 30 June 2019. The Board of Directors declared a final dividend of 8.0 cents per share, with record date and payment date on 12 September 2019 and 16 October 2019, respectively.
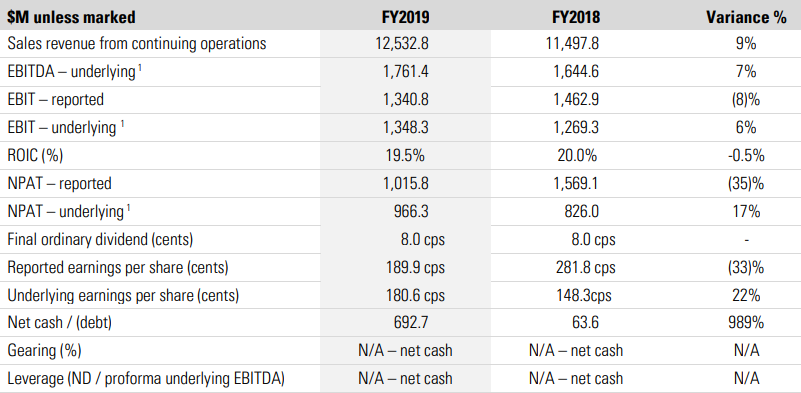
FY19 Key Financial Metrics (Source: Company Reports)
H1FY20 Group Outlook:As per the release, weaker commodity steel spreads in North Star and ASP, will lead to a reduction in underlying EBIT by 45% on H2FY19 EBIT of $499 Mn. The underlying net finance costs are expected to be lower than H2FY19, at a similar underlying tax rate. The expectations would be subject to spread, forex and market conditions.
Stock Recommendation:BSL’s share generated positive a YTD return of 13.09%. Its ROE for FY19 stood at 15.4%, better than the industry median of 12.3%, implying that the company generated a better return for its shareholders than its peer group. Its current ratio for FY19 is in-line to the industry median of 1.75x. Its debt to equity multiple for FY19 stood close to the industry median of 0.13x. Moreover, on the valuation front, its EV/Sales multiple, on NTM basis, stands at 0.5x, lower than the industry median of 1.4x. Hence, considering the above-stated facts, we recommend a “Buy” rating on the stock at the current market price of $12.010, down 2.119% on October 15, 2019.
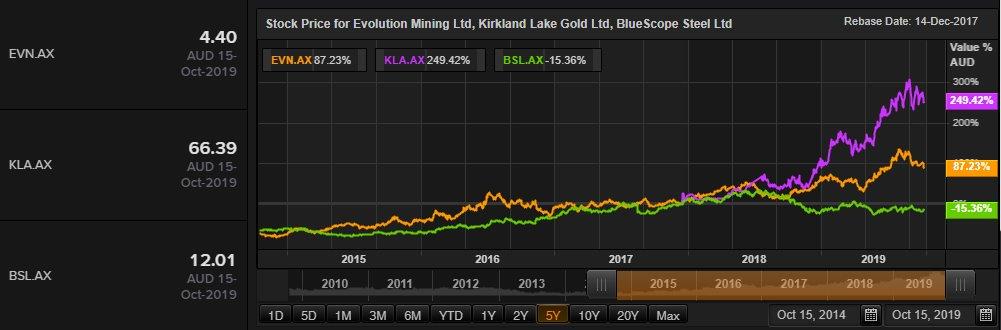
Comparative Price Chart (Source: Thomson Reuters)
Disclaimer
The advice given by Kalkine Pty Ltd and provided on this website is general information only and it does not take into account your investment objectives, financial situation or needs. You should therefore consider whether the advice is appropriate to your investment objectives, financial situation and needs before acting upon it. You should seek advice from a financial adviser, stockbroker or other professional (including taxation and legal advice) as necessary before acting on any advice. Not all investments are appropriate for all people. Kalkine.com.au and associated pages are published by Kalkine Pty Ltd ABN 34 154 808 312 (Australian Financial Services License Number 425376). The information on this website has been prepared from a wide variety of sources, which Kalkine Pty Ltd, to the best of its knowledge and belief, considers accurate. You should make your own enquiries about any investments and we strongly suggest you seek advice before acting upon any recommendation. Kalkine Pty Ltd has made every effort to ensure the reliability of information contained in its newsletters and websites. All information represents our views at the date of publication and may change without notice. To the extent permitted by law, Kalkine Pty Ltd excludes all liability for any loss or damage arising from the use of this website and any information published (including any indirect or consequential loss, any data loss or data corruption). If the law prohibits this exclusion, Kalkine Pty Ltd hereby limits its liability, to the extent permitted by law to the resupply of services. There may be a product disclosure statement or other offer document for the securities and financial products we write about in Kalkine Reports. You should obtain a copy of the product disclosure statement or offer document before making any decision about whether to acquire the security or product. The link to our Terms & Conditions has been provided please go through them and also have a read of the Financial Services Guide. On the date of publishing this report (mentioned on the website), employees and/or associates of Kalkine Pty Ltd do not hold positions in any of the stocks covered on the website. These stocks can change any time and readers of the reports should not consider these stocks as advice or recommendations.
 AU
AU
 Please wait processing your request...