Below are three large cap LIC stocks that have good dividend yields and are growing in terms of diversification to have less risky investments. Amidst the scenario that share price movements of the LICs do not necessarily correspond to the value of their portfolios and so the valuation gains might be unsustainable without reflecting the underlying performance of the company, these three major LICs become a must watch for 2018.
Australian Foundation Investment Company Ltd (ASX: AFI)
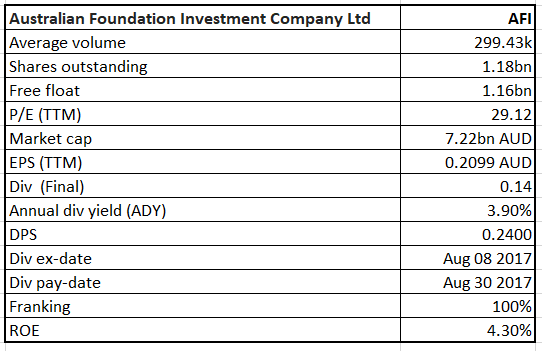
AFI Details
Consistent Dividend Yield: AFI has always aimed to provide shareholders with attractive investment returns through access to a growing stream of fully franked dividends and by enhancement of capital investment over the medium to long term. Monthly Net Tangible Asset (NTA) backing per share as on 30 November 2017 after tax was $5.15 whereas it was $5.09 as on 31 October 2017. The LIC is always consistent in paying after tax investment returns. The FY17 profits were A$245.3m which were down by 7.7% from FY16. Total Portfolio is slightly up from 2016, at A$6.9b as on 30 June 2017 and included cash.
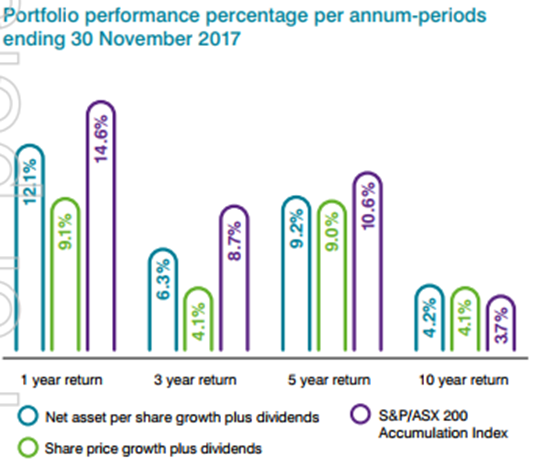
Portfolio Performance (Source: Company Reports)
Financial and Banking sector is facing a more challenging environment from the earnings aspect because of household and political pressure. In view of this background, it was seen that the share price was at slight premium to Net Asset, but has been at low levels compared to last year. AFI’s year on year earnings growth rate has been positive over the past 5 years, however, the most recent earnings are below average (11.2% for 5 years and 3.2% in last year). Going forward, the group is expecting the Australian economy to face more subdued growth rates over the medium term, while the group aims to meet its short-term commitments with its holding of cash and other short-term assets. In the past six months, the share prices increased by 6.07% and the stock trades at a high level. Sustaining the shortcomings and with capacity to provide dividends make AFI a good watch for any dip as an entry opportunity while it looks ‘Overvalued’ at the current price of $6.18

AFI Daily Chart (Source: Thomson Reuters)
Argo Investments Ltd (ASX: ARG)
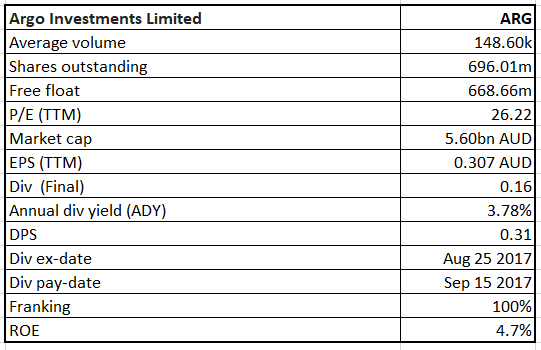
ARG Details
Diversified Investment Portfolio: Argo’s objective is to maximise long-term returns to shareholders through a balance of capital and dividend growth. Net Tangible Asset per share as on 30 November 2017 was $7.95 per share which included all the costs related to company tax and tax payable on all the gains which are realised from the portfolio sales. After deducting all such costs, it amounted to $6.97 per share. Argo’s Dividend Reinvestment Plan allows one’s holding by dealing directly with the Company rather than through the share market, and this saves the brokerage charges. The costs of managing the portfolio and administering the Company are borne internally and in the last financial year it equated to 0.17% of average assets under management, which is well below the other actively managed investment products. Looking from the financial aspect, there was a dip in the profits as compared to the last year with 2017 profits at $211.5 m compared to 2016 figure of $216.3 m. Earnings per share amounted to 30.7 cents in 2017 but 32.0 cents in 2016.
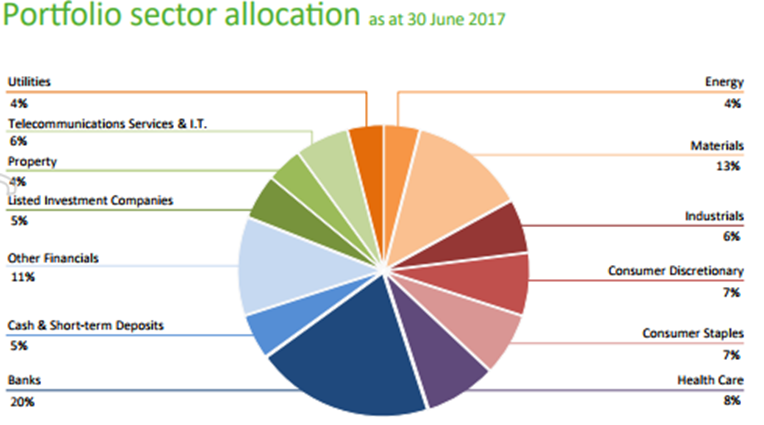
Sector-wise Portfolio Allocation (Source: Company Reports)
On the other hand, the group’s management costs are comparatively low from other management investment products. As on 30 June 2017, the total operating costs were 0.16% of average assets at the market value. In addition, Argo’s total shareholders’ return was 8.1% per annum on the share price and it was 9.9% including the franking credits and dividend payments. Recently, a total of 70,350 long-term incentive Performance Rights were vested into Argo due to pro rata achievement of the performance conditions which were measured over the four years ending on 30 June 2017. Over the last six months, ARG’s stock grew by 7.33% (as at December 19, 2017), while uncertain market conditions have been cited to make it difficult to forecast future performance. We give an “Expensive” recommendation at the current price of $8.16
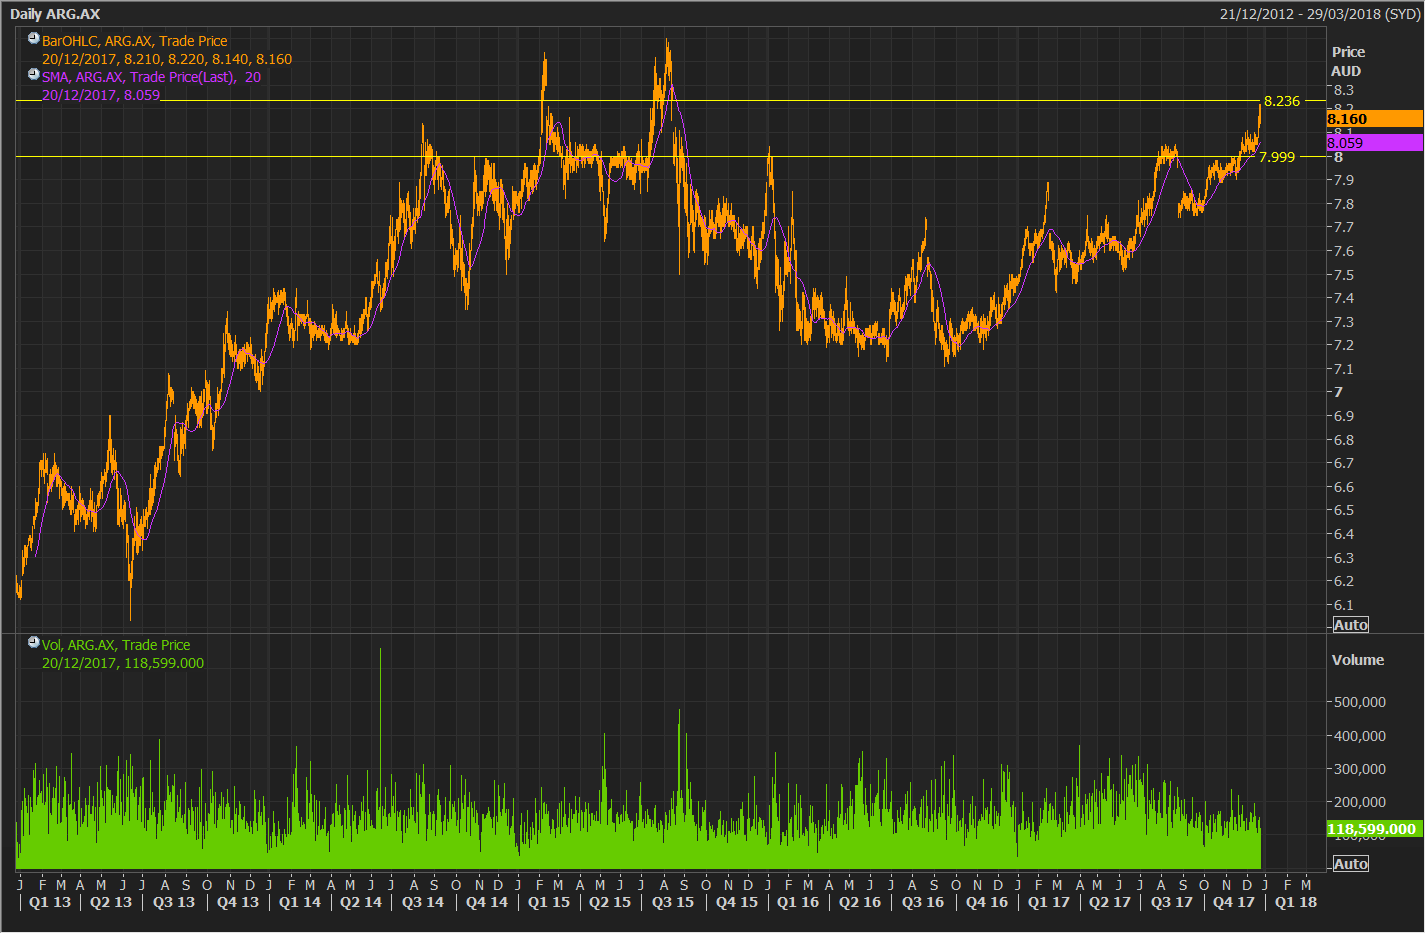
ARG Daily Chart (Source: Thomson Reuters)
Milton Corp Ltd (ASX: MLT)
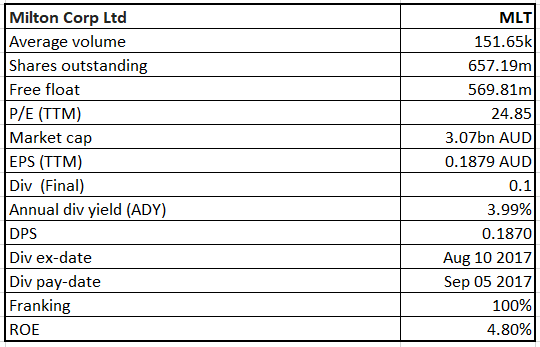
MLT Details
LIC with good returns: In its recent monthly NTA and Portfolio Report, NTA (after provision for tax on unrealised capital gains) amounted to $4.11 per share. Milton has a long-term track record of paying fully franked dividends which are predominantly funded by the dividends received from its investments in equities listed on ASX. It paid fully franked ordinary dividends totalling 18.7 cents per share out of the profits of 2017. It was reported that TPR (Total Portfolio Return), an indicator of LIC performance of MLT was 9.42% and it was better compared than the Accumulated Return of the All Ordinaries Index which was 9.26% over the 15 years. Milton’s internal management structure keeps costs down and aligns its interests with shareholders. The company recorded an underlying operating profit after tax of $122 million, which is equivalent to 18.7 cents per share. Despite of lower earnings, Milton managed to lift the dividend which demonstrates it as a listed company with a long-term investment philosophy.
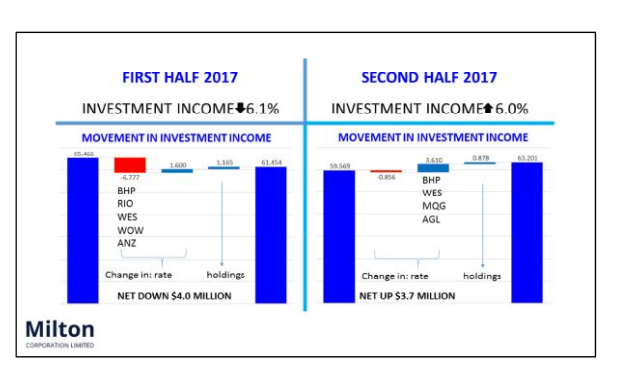
Investment Income Performance (Source: Company Reports)
The company grew its share capital throughout the year with $8.8 million which was raised through the dividend reinvestment plan that increased the shareholder participation rate. During 2017, the group continued to seek operating efficiencies by not compromising the research efforts of the investment management team and net cash from operating activities amounted to $122 million which exceeded the dividend payments made amounting to $121 million. Over the two years to September 2017, Milton’s shares have traded in a range of +2% and -3% for 80% of the time and it was a rare event that Milton’s closing share price was equal to its NTA of $4.51 as on 30 June 2017 which occurred one other time in the last 20 years. In the past six months, the stock price increased by 3.53% (as at December 19, 2017) and is at a high level. We give a “Hold” at the current price of $4.69
.png)
MLT Daily Chart (Source: Thomson Reuters)
Disclaimer
The advice given by Kalkine Pty Ltd and provided on this website is general information only and it does not take into account your investment objectives, financial situation or needs. You should therefore consider whether the advice is appropriate to your investment objectives, financial situation and needs before acting upon it. You should seek advice from a financial adviser, stockbroker or other professional (including taxation and legal advice) as necessary before acting on any advice. Not all investments are appropriate for all people. Kalkine.com.au and associated pages are published by Kalkine Pty Ltd ABN 34 154 808 312 (Australian Financial Services License Number 425376). The information on this website has been prepared from a wide variety of sources, which Kalkine Pty Ltd, to the best of its knowledge and belief, considers accurate. You should make your own enquiries about any investments and we strongly suggest you seek advice before acting upon any recommendation. Kalkine Pty Ltd has made every effort to ensure the reliability of information contained in its newsletters and websites. All information represents our views at the date of publication and may change without notice. To the extent permitted by law, Kalkine Pty Ltd excludes all liability for any loss or damage arising from the use of this website and any information published (including any indirect or consequential loss, any data loss or data corruption). If the law prohibits this exclusion, Kalkine Pty Ltd hereby limits its liability, to the extent permitted by law to the resupply of services. There may be a product disclosure statement or other offer document for the securities and financial products we write about in Kalkine Reports. You should obtain a copy of the product disclosure statement or offer document before making any decision about whether to acquire the security or product. The link to our Terms & Conditions has been provided please go through them and also have a read of the Financial Services Guide. On the date of publishing this report (mentioned on the website), employees and/or associates of Kalkine Pty Ltd do not hold positions in any of the stocks covered on the website. These stocks can change any time and readers of the reports should not consider these stocks as advice or recommendations.
 AU
AU

 Please wait processing your request...