.png)
Stocks’ Details
Vocus Group Limited
Cash Conversion Stood at 100%:Vocus Group Limited (ASX: VOC) operates as an integrated telecommunications provider and offers services across Australia and New Zealand markets. Recently, the company informed that one of its Directors named David Stoddart Wiadrowski has acquired 4,000 shares for a consideration of $11,939.95.
FY19 Financial Highlights for the Period ended 30 June 2019: VOC declared its full-year results, wherein the company reported revenue at $1,892.3 million as compared to $1,884.7 million in FY18 due to growth in Vocus Networks Services (VNS) and New Zealand, offset by declines in Retail. The company reported underlying NPAT at $105.5 million, down 17% on y-o-y basis on account of higher depreciation & amortization and increased finance costs. Underlying EBITDA stood at $360.1 million as compared to $366.7 million in FY18. Cash conversion during FY19 stood strong at 100% while the company reported a net debt of $1,034.4 million as at 30 June 2019.
.png)
FY19 Financial Highlights (Source: Company Reports)
Guidance:For FY20, the company expects underlying EBITDA within the range of $359 million to $379 million and capex within the range of $200 million to $210 million. The company expects cash conversion at ~90% to 95% for FY20. VOC expects EBITDA growth in Vocus Network Services of $20 million to $30 million, offset by a similar decline in Retail.
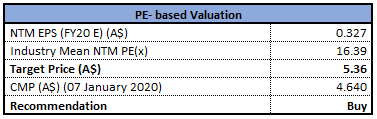
Valuation Methodology: Price to Earnings Multiple Approach
.png)
Price to Earnings Based Valuation (Source: Thomson Reuters)
Note: All forecasted figures and peers have been taken from Thomson Reuters, NTM-Next Twelve Months
Stock Recommendation:The stock of VOC is trading at $2.860 with a market capitalization of ~$1.77 billion. The stock has generated negative returns of 17.15% and 7.77% in the last three months and six months, respectively. At the current market price, the stock is quoting at the lower band of its 52-week trading range of $2.810 to $4.900. The company is looking for the re-orientation of the business strategy to capitalise the strength of the infrastructure assets. Considering the aforesaid facts, we have valued the stock using one relative valuation method, i.e., price to earnings multiple and arrived at a target price of lower double-digit growth (in % terms). Looking at the current trading levels, recent price movement, cash conversion and business prospect, we recommend a buy rating on the stock at the current market price of $2.860, up 0.351% as on 07 January 2020.
Alumina Limited
Posted Higher Adjusted EBITDA Margin from Bauxite Segment: Alumina Limited (ASX: AWC) operates in bauxite mining, alumina refining, alumina-based chemicals and aluminum smelting through joint venture interests. Recently, the company reported Vanguard Group (The Vanguard Group, Inc. and its controlled entities) as an initial substantial holder with 5.001% voting power.
Q3FY19 Highlights for the Period ended 30 September 2019: AWC announced its quarterly results, wherein the company reported adjusted EBITDA from Alcoa Alumina Segment at US$223 million as compared to US$369 million in Q2FY19, on account of 17% decline in API (Alumina Price Indices) only, which was partially offset by higher production, lower AUD exchange rate and lower maintenance costs. Adjusted EBITDA Margin from the Alcoa Alumina Segment stood at 19.6% as compared to 28.2% in the previous quarter. Alcoa Bauxite Segment reported an adjusted EBITDA of US$134 million as compared to US$112 million in Q2FY19, aided by higher sales volumes for both internal and 3rd party segments, followed by lower maintenance costs and improved performance at both MRN and CBG. The segment reported an adjusted EBITDA margin of 38.2% as compared to 35.8% in the previous quarter. The business reported AWAC Refining Business production of 3.2 mt and AWAC Mining Business production at 11.5 mbdt during the quarter.
.png)
Q3FY19 Operational Highlights (Source: Company Reports)
Valuation Methodology: Price to Book Multiple Approach
.png)
Price to Book Value Based Valuation (Source: Thomson Reuters), *1 USD = 1.45 AUD
Note: All forecasted figures and peers have been taken from Thomson Reuters, NTM-Next Twelve Months
Stock Recommendation: The stock of AWC is quoting at $2.330 with a market capitalization of ~6.59 billion. At the current market price, the stock is trading on the lower band of its 52-week trading range of $2.070 to $2.810. The stock has generated positive returns of 3.15% and 0.44% in the last one month and three months, respectively. Considering the aforesaid facts, we have valued the stock using one relative valuation method, i.e., price to book multiple and for the purpose, we have taken the peer group Rio Tinto Ltd (ASX: RIO), BHP Group Ltd (ASX: BHP), OZ Minerals Ltd (ASX: OZL). Therefore, we have arrived at a target price of lower double-digit upside (in % terms). Looking at the current price movement, trading levels, improved maintenance costs in the Alumina segment and business prospects, we recommend a ‘Buy’ rating on the stock at the current market price of $2.330, up 1.747% as on 07 January 2020.
Boral Limited
BLD Provides Q1FY20 Trading Update: Boral Limited (ASX: BLD) is engaged in the manufacturing and distribution of building and construction materials.
Q1FY20 Trading Update for the Period ended 30 September 2019: BLD announced its quarterly trading updates, wherein the company reported volume pressures in several businesses. Within the Australia segment, disruptions at Berrima & Peppertree resulted in an adverse earnings impact of ~$10 million. Within the North America segment, the business reported early signs of the US housing market improving yet to flow through, with benefits expected in the second half.
FY19 Financial Highlights for the Period ended 30 June 2019: BLD announced its full-year results, wherein the company reported revenue at $5,801 million, up 4% on y-o-y basis. The company reported EBITDA at $1,033 million and net profit after tax at $440 million, respectively, depicting a growth of 2% and 7% on y-o-y basis. During the year, Boral Australia reported $28 million savings from supply chain optimisation, organisational effectiveness and rightsizing programs. Within the USG Boral segment, the company reported cost savings of $4.5 million realised through project Horizon.
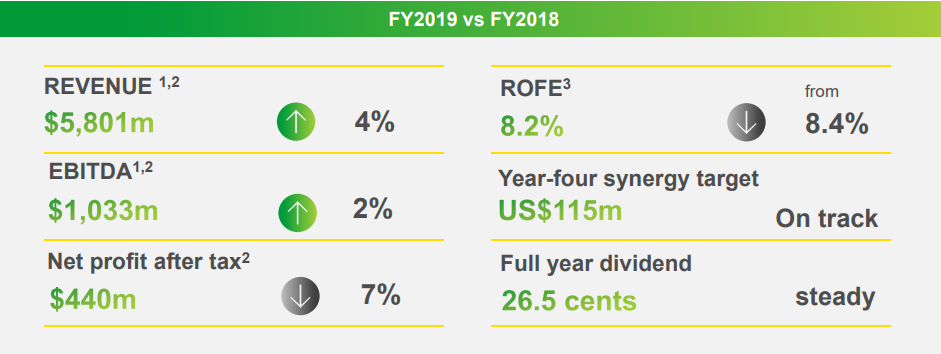
FY19 Operating Highlights (Source: Company Reports)
Outlook: For FY20, the company expects NPAT to be ~5 to 15% lower as compared to FY19, reflecting lower earnings and higher depreciation charges. The business expects FY20 property earnings to be ~$55 to $65 million and expects to deliver additional savings in the range of ~$40 to $50 million in FY20, on the back of supply chain optimization, organizational effectiveness and rightsizing programs.
Valuation Methodology: Price to Earnings Multiple Approach
Price to Earnings Based Valuation (Source: Thomson Reuters)
Note: All forecasted figures and peers have been taken from Thomson Reuters, NTM-Next Twelve Months
Stock Recommendation: The stock of BLD is quoting at $4.640 with a market capitalization of ~$5.33 billion. The stock has generated negative returns of 0.87% and 16.51% in the last three months and six months, respectively. At the current market price, the stock is quoting below the average of its 52-week trading range of $3.930 to $5.735. The business is focusing on reducing costs and improving earnings while the company expects cost optimisation of ~$40 to $50 million in FY20. Considering the aforesaid facts, we have valued the company using one relative valuation method, i.e., price to earnings multiple, and for the purpose, we have taken the peer group CSR Ltd (ASX: CSR), Adelaide Brighton Ltd (ASX: ABC), Fletcher Building Ltd (ASX: FBU), etc., and arrived at a target price of lower double-digit upside (in % terms). Looking at the current price movement, trading levels and improvement initiatives, we recommend a ‘Buy’ rating on the stock at the current market price of $4.640, up 1.978% as on 07 January 2020.
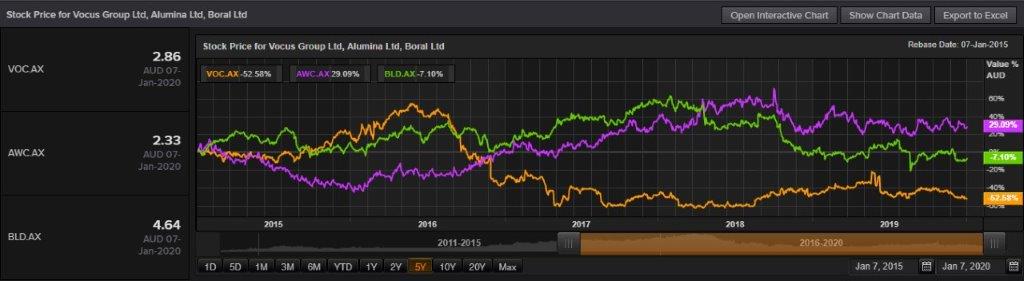
Comparative Price Chart (Source: Thomson Reuters)
Disclaimer
The advice given by Kalkine Pty Ltd and provided on this website is general information only and it does not take into account your investment objectives, financial situation or needs. You should therefore consider whether the advice is appropriate to your investment objectives, financial situation and needs before acting upon it. You should seek advice from a financial adviser, stockbroker or other professional (including taxation and legal advice) as necessary before acting on any advice. Not all investments are appropriate for all people. Kalkine.com.au and associated pages are published by Kalkine Pty Ltd ABN 34 154 808 312 (Australian Financial Services License Number 425376). The information on this website has been prepared from a wide variety of sources, which Kalkine Pty Ltd, to the best of its knowledge and belief, considers accurate. You should make your own enquiries about any investments and we strongly suggest you seek advice before acting upon any recommendation. Kalkine Pty Ltd has made every effort to ensure the reliability of information contained in its newsletters and websites. All information represents our views at the date of publication and may change without notice. To the extent permitted by law, Kalkine Pty Ltd excludes all liability for any loss or damage arising from the use of this website and any information published (including any indirect or consequential loss, any data loss or data corruption). If the law prohibits this exclusion, Kalkine Pty Ltd hereby limits its liability, to the extent permitted by law to the resupply of services. There may be a product disclosure statement or other offer document for the securities and financial products we write about in Kalkine Reports. You should obtain a copy of the product disclosure statement or offer document before making any decision about whether to acquire the security or product. The link to our Terms & Conditions has been provided please go through them and also have a read of the Financial Services Guide. On the date of publishing this report (mentioned on the website), employees and/or associates of Kalkine Pty Ltd do not hold positions in any of the stocks covered on the website. These stocks can change any time and readers of the reports should not consider these stocks as advice or recommendations.
 AU
AU
.jpg)
 Please wait processing your request...