Platinum Asset (Investment) Management Limited
.png)
PTM Details
Decent interim result while some headwinds are derailing the stock performance: Platinum Asset Management Limited (ASX: PTM) reported for lower Funds Under Management ($27,728.7 million) at the end of February 2018 as compared to $27,964.5 million at the end of January 2018. On the other hand, PTM has appointed Andrew Clifford, co-founder and Chief Investment Officer of the Platinum Group, to be the new Chief Executive Officer (Managing Director) effective from July 2018. He along with Clay Smolinski, will also assume the full portfolio management responsibilities for PTM’s global equity funds and mandates (including the flagship Platinum International Fund). Additionally, PTM for the first half of FY 18 has reported 14.9% growth in the total revenue to $185.9 million. The increase in revenue was driven by fee revenue, that rose up 6.95% to $166 million and other income (mostly investment-related), which was up 202% to $20 million.
.png)
1H 18 Financial Performance (Source: Company Reports)
The rise in fee revenue was due to the cumulative effect of strong investment returns, net client inflows and additional performance fees earned during the 1H 2018. These had offset the negative impact caused by the reduction in Platinum Trust Funds/Platinum Global Fund fees, that was effective from 3rd July 2017. For 1H 2018, net profit attributable to members was up by 7.08% to $102.2 million. However, the rise in profit was less than the increase in revenue, predominantly due to the inclusion of an employee incentive non-cash provision of $14.3 million, and a modest rise in other spending, mainly related to new product initiatives. Meanwhile, PTM stock is trading at a slightly high level and the market is also concerned about performance post the retirement of Kerr Neilson. The stock looks “Expensive” at the current price of $6.11
.png)
PTM Daily Chart (Source: Thomson Reuters)
Navigator Global Investments Ltd
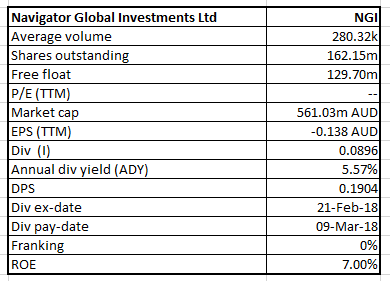
NGI Details
US Subsidiary Lighthouse acquires Multi-Manager Hedge Fund Business from Mesirow Financial: Navigator Global Investments Ltd (ASX: NGI) stock rose 4.1% on March 09, 2018 with emanating positive sentiments. The company’s United States subsidiary, Lighthouse Investment Partners, LLC has signed a definitive agreement with Mesirow Financial to acquire substantially all the assets of Mesirow Advanced Strategies (MAS), which is the multi-manager hedge fund division of Mesirow. The purchase consideration for the acquisition is on a deferred basis over an agreed number of years and will be dependent on the amount of assets which transition to Lighthouse. Further, this transaction is subject to a number of customary closing conditions and targets a mid-year closing. After the expected completion of the transaction, Mesirow Financial is expected to serve as a distribution partner to Lighthouse.
.png)
1H 18 Financial Performance (Source: Company Reports)
On the other hand, for 1H2018, NGI has reported statutory net loss after tax of $26,763 million, which is a fall of 418% from the corresponding period. Additionally, NGI declared unfranked interim dividend of US 7.0 cents per share (with 100% conduit foreign income credits) payable on March 09, 2018. Meanwhile, NGI stock has risen 7.21% in three months as on March 08, 2018. With good capital management and decent cash flows on balance sheet expected over next few years, and capability to pay dividends, while trading at a price lower than many peers; the stock still seems to have potential for growth. We give a “Speculative Buy” recommendation on the stock at the current price of $3.56
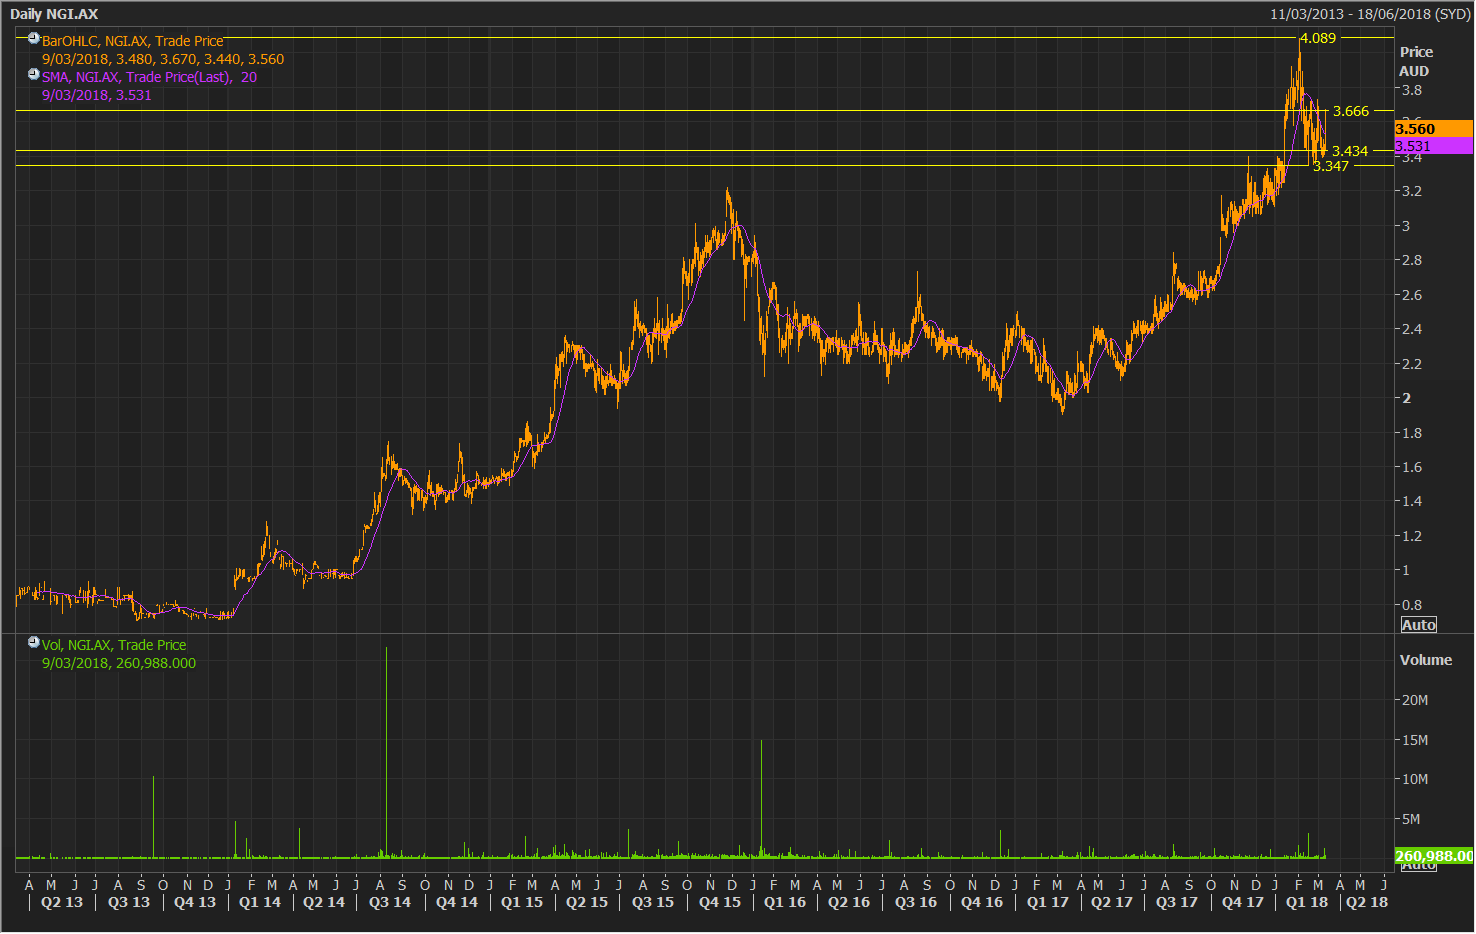
NGI Daily Chart (Source: Thomson Reuters)
Class Ltd
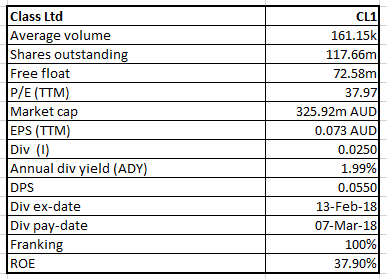
CL1 Details
Record Customer growth in 1H 2018: Class Ltd (ASX: CL1) reported 19% growth in the net profit after tax to $4.297m for 1H 2018. At the end of 1H 2018, CL1 had a total of 158,153 accounts compared to 143,944 at 30th June 2017, including 154,053 Self-managed Super Funds (SMSFs) on the Class Super product. Therefore, 14,209 new accounts (13,363 SMSF, 846 portfolios) have been loaded in 1H 2018, taking the total accounts to 158,153. Class Portfolio grew to 4,100 accounts as at 31st December 2017 from 3,254 as at 30th June 2017. Currently, 29% of Class Super’s 1,287 customers are using Class Portfolio.
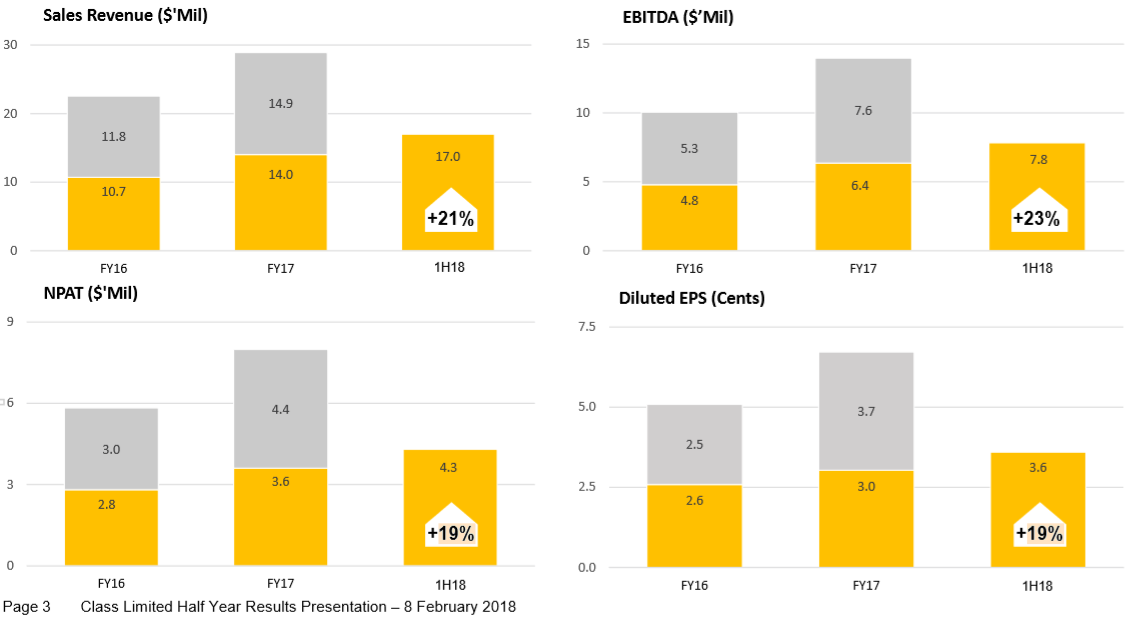
Interim Performance (Source: Company Reports)
The Annualised Committed Monthly Revenue (ACMR) in 1H 2018 has increased by 19% on the prior corresponding period to $33.7m. This represents the 95% of sales revenue that the company earned from software licence fees. However, as of Feb 2018, AMP had 9,500 funds on Class and accounted for less than 5% of ACMR. Further, AMP is migrating their funds to their own software, however no notice or timeframe for the completion of this migration has been provided. As a result, some challenges are merging for the business. On the other hand, the Q2 backlog of “to be loaded” SMSF will lead to Q3 fund growth, and the group is still positioned well for a post super reform market. However, CL1 stock has fallen 17.86% in three months as on March 08, 2018 at the back of the recent volatile environment despite a decent interim result. We give a “Hold” recommendation on the stock at the current price of $2.65
.png)
CL1 Daily Chart (Source: Thomson Reuters)
Disclaimer
The advice given by Kalkine Pty Ltd and provided on this website is general information only and it does not take into account your investment objectives, financial situation or needs. You should therefore consider whether the advice is appropriate to your investment objectives, financial situation and needs before acting upon it. You should seek advice from a financial adviser, stockbroker or other professional (including taxation and legal advice) as necessary before acting on any advice. Not all investments are appropriate for all people. Kalkine.com.au and associated pages are published by Kalkine Pty Ltd ABN 34 154 808 312 (Australian Financial Services License Number 425376). The information on this website has been prepared from a wide variety of sources, which Kalkine Pty Ltd, to the best of its knowledge and belief, considers accurate. You should make your own enquiries about any investments and we strongly suggest you seek advice before acting upon any recommendation. Kalkine Pty Ltd has made every effort to ensure the reliability of information contained in its newsletters and websites. All information represents our views at the date of publication and may change without notice. To the extent permitted by law, Kalkine Pty Ltd excludes all liability for any loss or damage arising from the use of this website and any information published (including any indirect or consequential loss, any data loss or data corruption). If the law prohibits this exclusion, Kalkine Pty Ltd hereby limits its liability, to the extent permitted by law to the resupply of services. There may be a product disclosure statement or other offer document for the securities and financial products we write about in Kalkine Reports. You should obtain a copy of the product disclosure statement or offer document before making any decision about whether to acquire the security or product. The link to our Terms & Conditions has been provided please go through them and also have a read of the Financial Services Guide. On the date of publishing this report (mentioned on the website), employees and/or associates of Kalkine Pty Ltd do not hold positions in any of the stocks covered on the website. These stocks can change any time and readers of the reports should not consider these stocks as advice or recommendations.
 AU
AU

 Please wait processing your request...