NAOS Emerging Opportunities Company Limited
Strong Investment Portfolio Return: NAOS Emerging Opportunities Company Limited (ASX: NCC) has recently released its strong investment performance of August month wherein NCC Investment Portfolio delivered a 3.94% return in one month (as of 31 August 2018) and was up by 1.45% as compared to S&P/ASX Small Ordinaries Accumulation Index (XSOAI) return of 2.49%. This brings the investment portfolio return since inception to +125.00% against the XSOAI which has returned +45.69%. On the other hand, the group delivered subdued performance in FY18 wherein revenue from ordinary activities decreased by 17% to $ 6,459,544 over the prior year. Based on the uplift in operating expenses, the company posted a profit after tax for the year of $4.12 Mn against the profit after tax of $ 4.58 Mn in FY17. However, the company declared a fully franked dividend of 3.50 cents per share and it will be payable on October 24, 2018 with the record date of October 09, 2018. This summarized a total dividend payment of 7.5 cents per share for the full year, representing a yield of 5.78%. Dividend rise of 3.6 % on Y-o-Y basis suggests that that the company has adequate capital to maintain a strong balance sheet to support future growth. As at 31 August 2018, the Company’s NTA after Tax increased to $1.24 from $1.21 at 31 July 2018.
.png)
Investment Portfolio Performance (Source: Company Reports)
Meanwhile, NCC stock has fallen 6.25 percent in the past six months as on September 27, 2018 and traded at its 52-week low price. By looking at its improvement in investment portfolio return and potentiality to generate shareholder return over the longer run whilst focusing on long-term capital growth, we give a “Speculative Buy” recommendation on the stock at the current market price of $1.310 (up 1.155% on October 1, 2018).
Magellan Global Trust
Traded at lower PE level despite robust performance in FY18: Magellan Global Trust (ASX: MGG) posted stellar results for FY18 with revenue up 33.8% higher at $452.59 million over the prior year. It was largely driven by the robust fund management business during the same period. As a result, Net Profit after Tax before MGG net offer costs and amortization grew by 37% and amounted to $ 268.89 Mn in FY 18. Besides this, the Company released its Fund Update for the period ended 31 August 2018. The Company’s portfolio outperformed the broader market during August 2018 with a return of 5.4 percent versus the 4.1 percent return of its benchmark MSCI World Net Total Return Index. Moreover, the portfolio delivered returns more than the benchmark over the previous three months and since inception. Despite all the current uncertainty in markets and across political landscapes, the company is clear and free from “the agitation of thought” and they continue to produce excellent results at the same time as paying very close attention to the management of downside risk. In our view, the Group performed consistently which was in line with its long-term track record of delivering strong relative returns during times of market volatility. Therefore, the group aims to continue to strive towards better performance during the upcoming periods despite short-term headwinds. The group also declared a final dividend of 3 cents.
.png)
Financial Summary (Source: Company Reports)
Moreover, the company disclosed its weekly NAV per unit of MGG and recorded $1.7218 as at 21 September 2018. Meanwhile, MGG stock price has risen 16.61% in the past six months as at September 28, 2018 and traded at a low PE level of 10.43x. Hence, we maintain our “Buy” recommendation on the stock at the current market price of $1.740.
Contango Income Generator Limited
Decent Investment Portfolio Performance (August 2018): Contango Income Generator Limited (ASX: CIE) reported decent performance for August month wherein CIE Investment Portfolio delivered a 2.86% return in one month (as of 31 August 2018) as compared to ASX All Ords Accum Index returns of 1.71%. For three months’ performance, CIE Investment Portfolio delivered decent returns of 5.78% (as at 31 August 2018) against the benchmark of 5.99%. Since inception, CIE Investment Portfolio generated 9.69% returns per annum against the ASX All Ords Accum Index returns of 10.73% p.a. Moreover, the Group posted Net Tangible Assets (NTA) per share before tax of $1.010 as on August 31, 2018 while NTA per share after tax amounted to $0.988. Overall, CIE’s holdings performed strongly during August month, of which, 10 of the stocks held were over 10% higher for the month. These included IPH Ltd, Magellan and IRESS Ltd. Most of the positives came from better than expected results. A great result, given these companies, make up 82% of the total CIE portfolio. In our view, the group’s objective is to increase the proportion of equity in its portfolio to around 95%. This would help CIE to realize its target of increasing the level of dividends and franking, in the future.
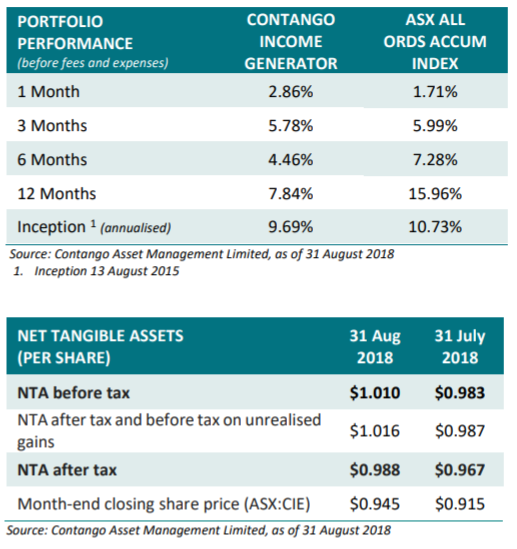
Investment Performance (Source: Company Reports)
Meanwhile, the stock has fallen 5.15 percent in the past six months as on September 27, 2018 and traded close to the average of 52 week high and low prices. The stock has a market capitalization of $95.63 Mn, a price-to-earnings ratio of 32.28x and a beta of 0.21x as of September 28, 2018, exhibiting undervalued stock at the current juncture. Hence, we maintain our “Speculative Buy” recommendation on the stock at the current market price of $0.920 by looking at the favourable investment outlook ahead.
Disclaimer
The advice given by Kalkine Pty Ltd and provided on this website is general information only and it does not take into account your investment objectives, financial situation or needs. You should therefore consider whether the advice is appropriate to your investment objectives, financial situation and needs before acting upon it. You should seek advice from a financial adviser, stockbroker or other professional (including taxation and legal advice) as necessary before acting on any advice. Not all investments are appropriate for all people. Kalkine.com.au and associated pages are published by Kalkine Pty Ltd ABN 34 154 808 312 (Australian Financial Services License Number 425376). The information on this website has been prepared from a wide variety of sources, which Kalkine Pty Ltd, to the best of its knowledge and belief, considers accurate. You should make your own enquiries about any investments and we strongly suggest you seek advice before acting upon any recommendation. Kalkine Pty Ltd has made every effort to ensure the reliability of information contained in its newsletters and websites. All information represents our views at the date of publication and may change without notice. To the extent permitted by law, Kalkine Pty Ltd excludes all liability for any loss or damage arising from the use of this website and any information published (including any indirect or consequential loss, any data loss or data corruption). If the law prohibits this exclusion, Kalkine Pty Ltd hereby limits its liability, to the extent permitted by law to the resupply of services. There may be a product disclosure statement or other offer document for the securities and financial products we write about in Kalkine Reports. You should obtain a copy of the product disclosure statement or offer document before making any decision about whether to acquire the security or product. The link to our Terms & Conditions has been provided please go through them and also have a read of the Financial Services Guide. On the date of publishing this report (mentioned on the website), employees and/or associates of Kalkine Pty Ltd do not hold positions in any of the stocks covered on the website. These stocks can change any time and readers of the reports should not consider these stocks as advice or recommendations.
 AU
AU

 Please wait processing your request...