
Stocks’ Details
Brambles Limited
Decent Growth in Sales and Profit: Brambles Limited (ASX: BXB) is a supply chain logistics company which specialises in the pooling of unit-load equipment and associated services. As on 17 February 2020, the market capitalisation of the company stood at ~$19.54 billion. The company has recently released its interim results for the period ending 31 December 2019, wherein it reported an increase of 7% in sales to US$2.39 billion and a growth of 5% in underlying profit to US$435.5 million. This resulted in the EPS to increase by 10% to 17.8 US cents per share. The decent financial performance enabled the Board to declare partially franked interim dividends of 9 US cps on ordinary fully paid shares which is to be paid on 9 April 2020. This represents a payout ratio of 50%.
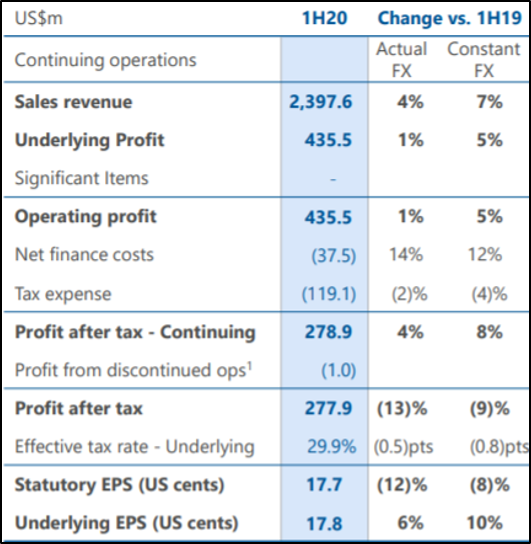
1H20 Financial Performance (Source: Company Reports)
What to Expect: The company has provided guidance for FY20 net interest expense and expects it to be between US$85 million to US$90 million. The company also anticipates a moderate growth of 1-2 pts in volume of US pallets in 2H20. FY20 CHEP Americas margin is expected to increase on FY19 levels. At constant FX and including the impact of AASB 16, BXB expects a middle single-digit growth in sales revenue and underlying profit.
Valuation Methodology: EV/EBITDA Multiple Based Valuation

EV/EBITDA Multiple Approach (Source: Thomson Reuters)
Note: All the forecasted figures are taken from Thomson Reuters, NTM: Next Twelve Months, 1USD=1.49 AUD
Stock Recommendation: As per ASX, the stock of BXB gave a return of 8.68% on YTD basis and a return of 2.93% in the past one month. The stock is also trading very close to its 52-week high of $13.420. During FY19, gross margin of the company stood at 47.4%, higher than the industry median of 38.2%. In the same time span, net margin and current ratio was in-line with the industry median and stood at 9.9% and 1.6x, respectively. Considering the returns, current trading levels, modest outlook and higher gross margin, we have valued the stock using EV/EBITDA based relative valuation method and arrived at a downside of higher single-digit (in percentage terms). Hence, we give an “Expensive” rating on the stock at the current market price of $13.140, up by 3.874% on 17 February 2020, owing to its recent release related to 1H20 interim results.
Atlas Arteria
Regulatory Approvals Received to Allow APRR Transaction: Atlas Arteria (ASX: ALX) is an operator and manager of a portfolio of toll road assets. As on 17 February 2020, the market capitalisation of the company stood at ~$7.39 billion. The company has recently announced that it has obtained anti-trust clearance from the French Ministry of the Economy. The company will now acquire a further 6.14% indirect interest in APRR and ADELAC. ALX has also announced that it will declare its results for the full year ended 31 December 2019 on 27 February 2020.
During the quarter ended December 2019, weighted average toll revenue increased by 6.6% on pcp. This was mainly driven by strong performance in Light Vehicle Traffic. In the same time span, weighted average traffic increased by 6.2% as compared to pcp.
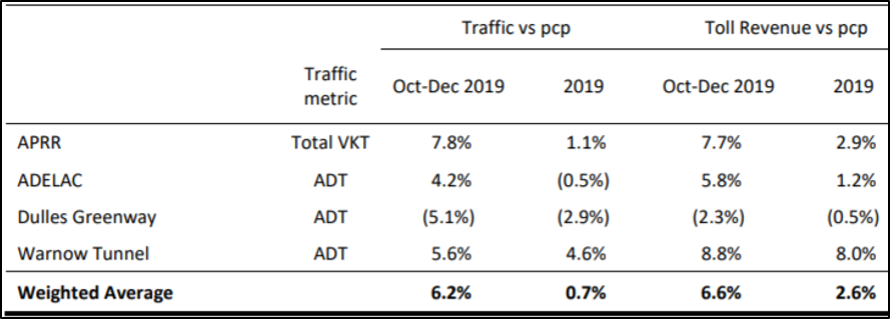
Growth in Traffic and Toll Revenue (Source: Company Reports)
Growth Opportunities and Future Expectations: The company has placed its focus on streamlining the existing portfolio and is expecting new opportunities to meet strategic objectives. The company has a positive outlook and expects to benefit from internalisation to flow through into H2 2019.
Stock Recommendation: As per ASX, the stock of ALX gave a return of 5.07% in the past six months and a return of 2.94% in the past one month. The stock is also trading very close to its 52-weeks high level of $8.510. During 1H19, gross margin of the company stood at 81.7%, higher than the industry median of 68.6%. In the same time span, EBITDA margin of the company was 33.7% as compared to the industry median of 52.2%. On the TTM basis, the stock is trading at a price to cash flow multiple of 20.2x, higher than the industry average (Industrials) of 11.9x. Considering the returns, trading levels, higher gross margin and decent outlook, we recommend our investors to wait for the price correction and give a watch stance on the stock at the current market price of $8.450, up by 0.476% on 17 February 2020.
GWA Group Limited
Decent Increase in Revenue and EBITDA: GWA Group Limited (ASX: GWA) is a supplier of building fixtures and fittings to residential and commercial premises. As on 17 February 2020, the market capitalisation of the company stood at ~$1.03 billion. The company has recently released its interim results for the period ending 31 December 2019, wherein it reported an increase of 12.9% in revenue to $206.3 million and a growth of 4.3% in EBITDA to $48.1 million. This was mainly due to increased interest costs on the debt related to the acquisition of Methven. The ongoing robust financial position of the company enabled the Board to declare a fully franked interim dividend of 8 cents per share which is to be paid on 4 March 2020.
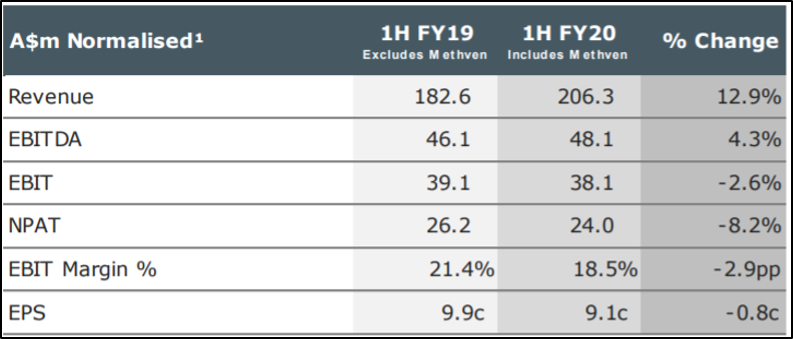
1H20 Financial Performance (Source: Company Reports)
Growth Opportunities and Future Guidance: The company is prioritizing to add value to customers through superior execution and deliver experiences to drive growth in revenue and market share. The company will continue to invest in core brands and is expecting to launch new shower and tapware ranges in both the UK and Asia. In FY20, GWA’s earnings are expected to be in the range of $80 million to $85 million. The company also expects interest costs of around ~$6-7 million.
Valuation Methodology: EV/EBITDA Based Valuation
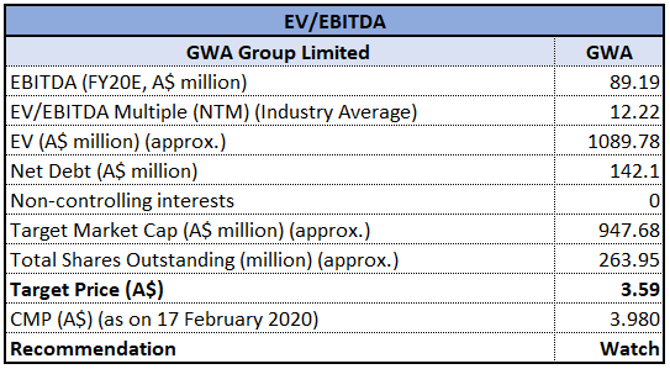
EV/EBITDA Based Valuation (Source: Thomson Reuters)
Note: All the forecasted figures are taken from Thomson Reuters, NTM: Next Twelve Months
Stock Recommendation: As per ASX, the stock of GWA gave a return of 27.04% in the past 3 months and a return of 11.43% in the last one month. The stock is also trading very close to its 52-weeks high level of $3.990. During 1H20, net margin and ROE of the company witnessed a slight increase on the prior period and stood at 11.4% and 6.4%, respectively. Considering the returns, trading levels, improvement in margins and decent outlook, we have valued the stock using EV/EBITDA valuation approach and have arrived at a downside of higher single-digit (in percentage terms). For the said purposes, we have considered Reliance Worldwide Corporation Ltd (ASX: RWC), CSR Ltd (ASX: CSR) etc. as peers. Hence, we give a watch stance on the stock at the current market price of $3.980, up by 2.051% on 17 February 2020, owing to recent release of its interim results.
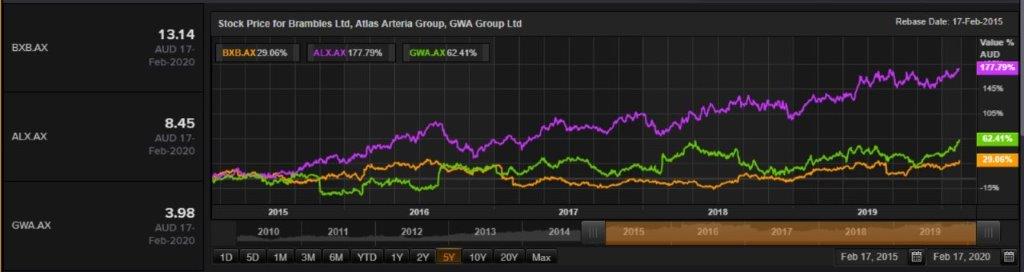
Comparative Price Chart (Source: Thomson Reuters)
Disclaimer
The advice given by Kalkine Pty Ltd and provided on this website is general information only and it does not take into account your investment objectives, financial situation or needs. You should therefore consider whether the advice is appropriate to your investment objectives, financial situation and needs before acting upon it. You should seek advice from a financial adviser, stockbroker or other professional (including taxation and legal advice) as necessary before acting on any advice. Not all investments are appropriate for all people. Kalkine.com.au and associated pages are published by Kalkine Pty Ltd ABN 34 154 808 312 (Australian Financial Services License Number 425376). The information on this website has been prepared from a wide variety of sources, which Kalkine Pty Ltd, to the best of its knowledge and belief, considers accurate. You should make your own enquiries about any investments and we strongly suggest you seek advice before acting upon any recommendation. Kalkine Pty Ltd has made every effort to ensure the reliability of information contained in its newsletters and websites. All information represents our views at the date of publication and may change without notice. To the extent permitted by law, Kalkine Pty Ltd excludes all liability for any loss or damage arising from the use of this website and any information published (including any indirect or consequential loss, any data loss or data corruption). If the law prohibits this exclusion, Kalkine Pty Ltd hereby limits its liability, to the extent permitted by law to the resupply of services. There may be a product disclosure statement or other offer document for the securities and financial products we write about in Kalkine Reports. You should obtain a copy of the product disclosure statement or offer document before making any decision about whether to acquire the security or product. The link to our Terms & Conditions has been provided please go through them and also have a read of the Financial Services Guide. On the date of publishing this report (mentioned on the website), employees and/or associates of Kalkine Pty Ltd do not hold positions in any of the stocks covered on the website. These stocks can change any time and readers of the reports should not consider these stocks as advice or recommendations.
 AU
AU
.jpg)
 Please wait processing your request...