.png)
Stocks’ Details
Transurban Group
Fall in Average Daily Traffic: Transurban Group (ASX: TCL) is the owner, operator and developer of electronic toll roads and intelligent transport systems. The market capitalisation of the company stood at $33.78 Bn as on 17th April 2020. During March 2020 quarter, the company experienced a significant impact on its all assets and markets due to the restrictions in movement imposed by the governments in response to the COVID-19 pandemic. Consequently, the company’s average daily traffic (ADT) declined by 4.8% during the period. During the period, the company raised $2.1 billion of new debt facilities, which include $1.3 billion in new working capital facilities.
The company has paid distribution amounting to 31.0 cents per share on 14th February 2020 for 1H FY20. However, TCL has suspended its distribution guidance (31.0 cents) for the six months to 30 June 2020 on the face of the current uncertainty in the trading outlook. At the current market price of $13.180, the annual dividend yield of the company stood at 4.94%, which is higher than the industry median (Transport Infrastructure) of 3.9% on TTM basis.
.png)
EBITDA Margins (Source: Company Reports)
Distribution for 2H FY20: Transurban anticipates paying its distribution for 2H FY20 in line with free Cash, excluding capital releases. The company possesses enough liquidity, which will help in meeting capital requirements and debt refinancing obligations to end of FY21.
Valuation Methodology: EV/EBITDA Multiple Based Relative Valuation
.png)
EV/EBITDA Based Valuation (Source: Thomson Reuters)
Note: All forecasted figures have been taken from Thomson Reuters, NTM: Next Twelve Months
Stock Recommendation: Transurban has a decent capital position, and it is targeting capital markets issuances when global debt markets stabilize. Gross margin and EBITDA margin of the company stood at 60.7% and 52.2% in 1H FY20, reflecting YoY growth of 6.2% and 5.5%, respectively. We have valued the stock using EV/EBITDA multiple based illustrative relative valuation method and arrived at a target price, which is offering an upside of mid-single-digit (in percentage terms). Hence, considering the decent growth in key margins, strong capital position and sufficient liquidity, we maintain a “Hold” rating on the stock at the current market price of $13.180 per share, up by 6.721% on 17th April 2020.
Monadelphous Group Limited
New Contracts Secured: Monadelphous Group Limited (ASX: MND) is engaged in the provisioning of engineering services within Australia. The market capitalisation of the company stood at $1.07 Bn as on 17th April 2020. Maintenance and Industrial Services division of MND delivered a strong performance during 1H FY20 with a record revenue amounting to $584.5 million, up by 16% on pcp. This growth was supported by an increase in shutdown and maintenance work throughout the resources sector as well as a ramp-up in offshore oil and gas service activity. The revenue of the whole group stood at $852.0 million, reflecting a rise of 2.6% over pcp during the half-year. MND secured contracts with Rio Tinto and Albemarle Lithium during the same period.
The company declared a fully franked interim dividend of 22 cps during 1H FY20. The annual dividend yield of the company stood at 3.97% at the current market price of $11.480 per share.
.png)
Key Financials (Source: Company Reports)
Withdrawal of Guidance: Recently, the company suspended its revenue guidance for the 2019/2020 in the awake of rising uncertainty from COVID-19 pandemic.
Valuation Methodology:Price to Earnings Multiple Based Relative Valuation
.png)
Price to Earnings Multiple Based Valuation (Source: Thomson Reuters)
Note: All forecasted figures and peers have been taken from Thomson Reuters, NTM-Next Twelve Months
Stock Recommendation: Current ratio of the company stood at 2.05x in 1H FY20 against the industry median of 1.16x. This reflects that MND is in a decent position to address its short-term obligations as compared to the broader industry. Debt to equity of the company stood at 0.21x versus an industry median of 0.74x. We have valued the stock using Price to Earnings multiple based illustrative relative valuation method and arrived at a target price, which is offering an upside of higher single-digit (in percentage terms). Thus, in light of decent liquidity position, stable balance sheet and performance in 1HFY20, we give a “Buy” recommendation on the stock at the current market price of $11.480 per share, up by 1.324% on 17th April 2020.
CIMIC Group Limited
Stable Operating Profit During FY19: CIMIC Group Limited (ASX: CIM) mainly provides construction, mining and operation and maintenance services to the infrastructure sector. Recently, the company announced that till now it has bought back 4,718,804 shares at the consideration of $107,689,045 with respect to its daily share buy-back notice. In response to COVID-19, the company has undertaken steps which will allow CIM to meet its clients’ needs over this challenging period, establishing teams to manage the continuity of its operations. During FY19, the company reported revenue amounting to $14.7 billion along with stable operating profit, PBT and NPAT margins of 8.4%, 7.5% and 5.4% respectively. Moreover, during March 2020, CIMIC Group’s company, UGL has secured two rail sector contracts, which will be generating total revenue of over $180 million.
The company has paid an interim dividend of 71.0 cents per share and did not declare final dividend for FY19 due to one-off BICC impairment. However, the company has returned $525.8 million of cash to shareholders in FY19 in the form of dividends paid of $509.1 million and share buyback of $16.7 million.
.png)
Financial Performance (Source: Company Reports)
NPAT Guidance for the Year Ahead: For FY20, the company is expecting NPAT in the ambit of $810 million to $850 million, however, this guidance is subject to market conditions.
Valuation Methodology:Price to Earnings Multiple Based Relative Valuation
.png)
Price to Earnings Multiple Based Valuation (Source: Thomson Reuters)
Note: All forecasted figures and peers have been taken from Thomson Reuters, NTM-Next Twelve Months
Stock Recommendation: Gross margin and EBITDA margin of the CIM stood at 44.1% and 14.4% in FY19 as compared to the industry median of 12.5% and 5.5%, respectively. During the span of one month, the stock of CIMIC has provided returns of 18.22%. We have valued the stock using Price to Earnings multiple based relative valuation method and arrived at a target price, which is offering an upside of lower double-digit (in percentage terms). Hence, considering decent key margins, contracts secured by group company and outlook, we give a “Buy” recommendation on the stock at the current market price of $23.800 per share with a rise of 4.523% on 17th April 2020.
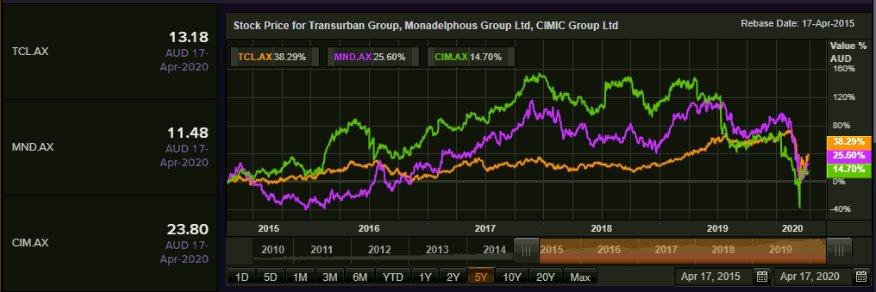
Comparative Price Chart (Source: Thomson Reuters)
Disclaimer
The advice given by Kalkine Pty Ltd and provided on this website is general information only and it does not take into account your investment objectives, financial situation or needs. You should therefore consider whether the advice is appropriate to your investment objectives, financial situation and needs before acting upon it. You should seek advice from a financial adviser, stockbroker or other professional (including taxation and legal advice) as necessary before acting on any advice. Not all investments are appropriate for all people. Kalkine.com.au and associated pages are published by Kalkine Pty Ltd ABN 34 154 808 312 (Australian Financial Services License Number 425376). The information on this website has been prepared from a wide variety of sources, which Kalkine Pty Ltd, to the best of its knowledge and belief, considers accurate. You should make your own enquiries about any investments and we strongly suggest you seek advice before acting upon any recommendation. Kalkine Pty Ltd has made every effort to ensure the reliability of information contained in its newsletters and websites. All information represents our views at the date of publication and may change without notice. To the extent permitted by law, Kalkine Pty Ltd excludes all liability for any loss or damage arising from the use of this website and any information published (including any indirect or consequential loss, any data loss or data corruption). If the law prohibits this exclusion, Kalkine Pty Ltd hereby limits its liability, to the extent permitted by law to the resupply of services. There may be a product disclosure statement or other offer document for the securities and financial products we write about in Kalkine Reports. You should obtain a copy of the product disclosure statement or offer document before making any decision about whether to acquire the security or product. The link to our Terms & Conditions has been provided please go through them and also have a read of the Financial Services Guide. On the date of publishing this report (mentioned on the website), employees and/or associates of Kalkine Pty Ltd do not hold positions in any of the stocks covered on the website. These stocks can change any time and readers of the reports should not consider these stocks as personalised advice.
 AU
AU

 Please wait processing your request...