Syrah Resources Limited (ASX: SYR)
SYR is into graphite exploration with its flagship Balama Graphite Operation in Mozambique and a downstream Battery Anode Material Project in the United States. It operates in two segments - Balama and Vidalia. SYR holds a market capitalization of AUD 1.60bn as of 1st November 2022.
Balama Graphite Operations Updates: As announced on October 27, 2022, the company resumed logistics activities at its Balama Graphite plant. In 3QFY22, it had clocked 38kt of production at Balama operations and achieved a positive net operating profit before C1 and C2 costs. The company signed MOU with Ford and SK On to supply anode battery material from the Vidalia plant to the BlueOval SK joint venture. The company is about to commence a definitive feasibility study to expand Vidalia to a 45ktpa of anode materials. SYR closed the quarter with a cash balance of USD 136mn.
Technical Analysis: On the daily chart, SYR’s stock price has facing resistance at the rising trendline, indicating the possibility of a downward move hereon. Moreover, RSI (14-period) is placed in overbought territory and showing a reading of 75.913 and supporting a downside correction. However, prices are sustaining above the trend-following indicators 21-period and SMA 50-period SMA, which may act as a support zone for the stock. An important support level for the stock is AUD 2.25, while the key resistance level is AUD 2.77.
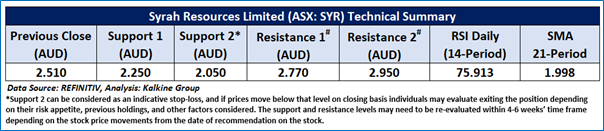
Considering the company’s current price levels encountering resistance at the trendline, momentum oscillator analysis, a ‘Watch’ recommendation is given on the stock. The stock was analysed as per the closing price of AUD 2.51 per share, up ~5.02%, as on 1st November 2022.
Individuals can evaluate the stock based on the support and resistance levels provided in the report in case of keen interest, taking into consideration the risk-reward scenario.
Daily Technical Chart – SYR
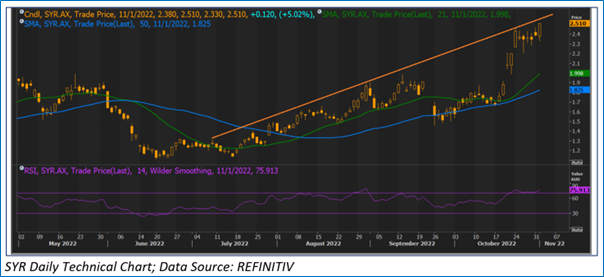
Cobalt Blue Holdings Limited (ASX: COB)
COB is an exploration company focused on the development and commercialization of the Broken Hill Cobalt Project located in New South Wales. The current market capitalization as of 1st November 2022 stood at AUD 211.58mn.
Update on its Broken Hill Cobalt Project: COB commenced feasibility studies at its Broken Hill Cobalt project. The company is conducting soli investigations and drilling of waste rock sample collection. Bulk sampling work delivered 4.5kt of the ore for processing at the Demonstration plant. This was slightly higher compared to the initial plan of 3.5k-4kt. During the quarter ending September 2022, COB incurred AUD 6.2mn towards exploration and evaluation activities. The company closed the quarter with a cash balance of AUD 8.13mn.
Technical Analysis: On the daily chart, COB broke a rising trendline and facing resistance of the same, indicating the possibility of downside correction hereon. Moreover, the momentum oscillator RSI (14-period) is below the mid-point and showing a reading of ~40.628. Further, the prices are trading below the trend-following indicators 21-period SMA and 50-period SMA, which may act as a resistance zone in the near term. An important support level for the stock is at AUD 0.58, while the key resistance level is at AUD 0.72.
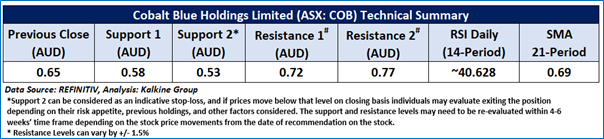
Considering the company's current price levels have facing resistance and momentum indicator analysis, a 'Watch' recommendation has been given on the stock. The stock was analysed as per the closing price of AUD 0.65 per share, up ~1.562% as of 1st November 2022.
Individuals can evaluate the stock based on the support and resistance levels provided in the report in case of keen interest, taking into consideration the risk-reward scenario.
Daily Technical Chart – COB
IGO Ltd. (ASX: IGO)
IGO is a leading exploration company involved in mainly the mining and processing of nickel, copper and cobalt.
1QFY23 Updates: IGO posted a record quarterly production of spodumene at Greenbushes. It is ramping-up lithium hydroxide production at the Kwinana plant. For the quarter ending September 2022, IGO achieved nickel production of 9.76kt. This is a 50% increase over the preceding quarter. It had posted 7% QoQ rise in spodumene concentration production of 361kt. The company plans to achieve a total installed capacity of 2.5Mtpa of spodumene concentrates at Greenbushes.
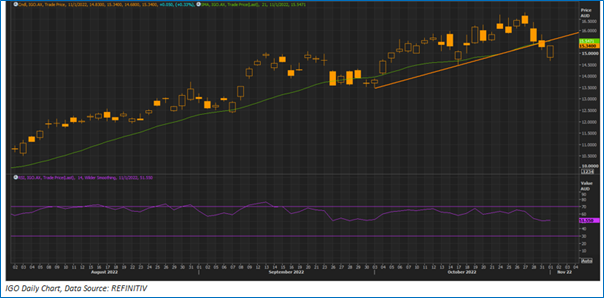
Technical Analysis: On a daily chart, IGO prices recently broke an upward sloping trend line by downside and the prices are sustaining below the same from past several days that indicates the stock might fall further. Prices are currently trading below its 21-period on a daily chart that further support our watch recommendation. Moreover, the momentum oscillator RSI (14-period) came down from near to the overbought region and currently trading at ~51.55, indicating weak momentum for the stock price. An important support level for the stock, is placed at AUD 13.910 while the key resistance level is placed at AUD 17.610.
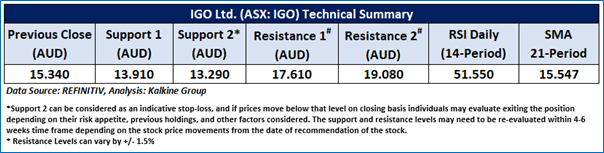
Considering the company’s current price levels sustaining below an upward sloping trend line, momentum oscillator analysis, it is prudent to recommend a ‘Watch’ stance on this stock. The stock was analysed as per the closing price of AUD 15.340 per share on 01st November 2022, up ~0.33%.
Individuals can evaluate the stock based on the support and resistance levels provided in the report in case of keen interest taking into consideration the risk-reward scenario.
Daily Technical Chart – IGO
Note 1: Past performance is neither an Indicator nor a guarantee of future performance.
Note 2: Investment decision should be made depending on an individual’s appetite for upside potential, risks, and any previous holdings. This recommendation is purely based on technical analysis, and fundamental analysis has not been considered in this report.
Note 3: Related Risks: This report may be looked at from high-risk perspective. Recommendations provided in this report are solely based on technical parameters, and the fundamental performance of the stocks has not been considered in the decision-making process. Other factors which could impact the stock prices include market risks, regulatory risks, interest rates risks, currency risks, social and political instability risks etc.
Technical Indicators Defined: -
Support: A level at which the stock prices tend to find support if they are falling, and a downtrend may take a pause backed by demand or buying interest. Support 1 refers to the nearby support level for the stock and if the price breaches the level, then Support 2 may act as the crucial support level for the stock.
Resistance: A level at which the stock prices tend to find resistance when they are rising, and an uptrend may take a pause due to profit booking or selling interest. Resistance 1 refers to the nearby resistance level for the stock and if the price surpasses the level, then Resistance 2 may act as the crucial resistance level for the stock.
Stop-loss: It is a level to protect further losses in case of unfavourable movement in the stock prices.
The Green colour line reflects the 21-period moving average. SMA helps to identify existing price trends. If the prices are trading above the 21-period, prices are currently in a bullish trend (Vice – Versa).
The Blue colour line reflects the 50-period moving average. SMA helps to identify existing price trends. If the prices are trading above the 50-period, prices are currently in a bullish trend (Vice – Versa).
The Orange colour line represents the Trendline.
The Purple colour line in the chart’s lower segment reflects the Relative Strength Index (14-Period), which indicates price momentum and signals momentum in trend. A reading of 70 or above suggests overbought status, while a reading of 30 or below suggests an oversold status.
Disclaimer
This report has been issued by Kalkine Pty Limited (ABN 34 154 808 312) (Australian financial services licence number 425376) (“Kalkine”) and prepared by Kalkine and its related bodies corporate authorised to provide general financial product advice. Kalkine.com.au and associated pages are published by Kalkine.
Any advice provided in this report is general advice only and does not take into account your objectives, financial situation or needs. You should therefore consider whether the advice is appropriate to your objectives, financial situation and needs before acting upon it.
There may be a Product Disclosure Statement, Information Statement or other offer document for the securities or other financial products referred to in Kalkine reports. You should obtain a copy of the relevant Product Disclosure Statement, Information Statement or offer document and consider the statement or document before making any decision about whether to acquire the security or product.
You should also seek advice from a financial adviser, stockbroker or other professional (including taxation and legal advice) as necessary before acting on any advice in this report or on the Kalkine website. Not all investments are appropriate for all people.
The information in this report and on the Kalkine website has been prepared from a wide variety of sources, which Kalkine, to the best of its knowledge and belief, considers accurate. Kalkine has made every effort to ensure the reliability of information contained in its reports, newsletters and websites. All information represents our views at the date of publication and may change without notice.
Kalkine does not guarantee the performance of, or returns on, any investment. To the extent permitted by law, Kalkine excludes all liability for any loss or damage arising from the use of this report, the Kalkine website and any information published on the Kalkine website (including any indirect or consequential loss, any data loss or data corruption). If the law prohibits this exclusion, Kalkine hereby limits its liability, to the extent permitted by law, to the resupply of services.
Please also read our Terms & Conditions and Financial Services Guide for further information.
On the date of publishing this report (referred to on the Kalkine website), employees and/or associates of Kalkine and its related entities do not hold interests in any of the securities or other financial products covered on the Kalkine website unless those persons comply with certain safeguards, procedures, and disclosures.
Kalkine Media Pty Ltd, an affiliate of Kalkine Pty Ltd, may have received, or be entitled to receive, financial consideration in connection with providing information about certain entity(s) covered on its website.
 AU
AU
.jpg)
 Please wait processing your request...