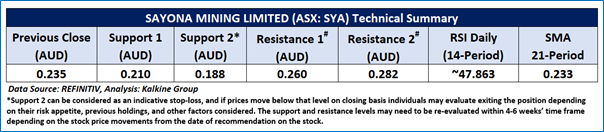
Sayona Mining Limited (ASX: SYA)
Sayona Mining Limited (ASX: SYA) is a lithium-focused exploration company with projects in Quebec, Canada, and Western Australia. The current market capitalization as of 31st October 2022 stood at AUD 1.95bn.
Lithium Exploration Update: Restart program at its North American Lithium (NAL) mine is on track, and production is expected in 1QFY23. It had appointed L. Fourner & Fils as a contractor to the restart operation. It had launched pre-feasibility study for Moblan Lithium project. This is in-line with its production plan of lithium carbonate at NAL. In August, it raised the funding facility to AUD 200 million under Acuity Capital. As of September 2022 quarter, SYA has over AUD 193 million available under the facility. The company’s Tansim Lithium project is estimated to hold the mineral prospect of between 5mn tonnes and 25mn tonnes of Lithium Oxide at an estimated grade of 1.2/1.3%.
Cash Position: As of September 30, 2022, SYA holds a cash balance of AUD 159.23mn.
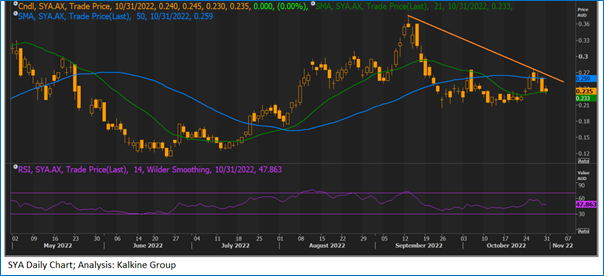
Technical Analysis: On the daily chart, SYA’s stock price has facing resistance at the falling trendline, indicating the possibility of a downward move hereon. Moreover, RSI (14-period) is below the mid-point, showing a reading of 47.863 and supporting a downside correction. Further, prices are still sustaining below the trend-following indicators 50-period SMA, which may act as a resistance zone for the stock. An important support level for the stock is AUD 0.21, while the key resistance level is AUD 0.26.
Individuals can evaluate the stock based on the support and resistance levels provided in the report in case of keen interest, taking into consideration the risk-reward scenario.
Considering the company’s current price levels encountering resistance at the falling trendline, momentum oscillator analysis, a ‘Watch’ recommendation is given on the stock. The stock was analysed as per the closing price of AUD 0.235 per share, as on 31st October 2022.
Daily Technical Chart – SYA
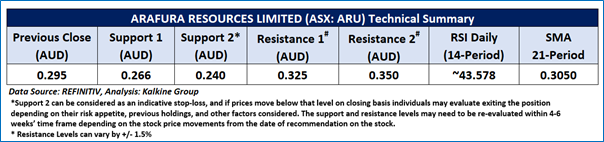
Arafura Resources Limited (ASX: ARU)
Arafura Resources Limited (ASX: ARU) is a global supplier of rare earth elements (REE). The company supplies two high values REEs: Neodymium and Praseodymium (NdPr). The current market capitalization as of 31st October 2022 stood at AUD 509.59mn.
Project Update: Front-end Engineering and Design work is nearing completion at the company's hydrometallurgical plant (Nolans NdPr project). It commenced construction tendering work, and commencement of Final Investment Decision is expected to kick off in 2023. It is targeting to begin long-lead procurement in January 2023. ARU is moving away from fossil fuels with deployment of renewable power options at its Nolans Project power station.
Cash Reserves: Following the fundraising in August 2022, ARU had AUD 49mn in cash reserves. During the quarter ending September 2022, it spent about AUD 1.0mn towards exploration and evaluation activities.
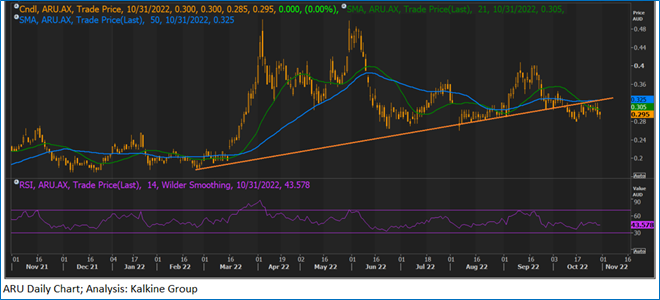
Technical Analysis: On the daily chart, ARU broke a rising trendline and facing resistance of the same, indicating the possibility of downside correction hereon. Moreover, the momentum oscillator RSI (14-period) is near the mid-point and showing a reading of ~43.578. Further, the prices are trading above the trend-following indicator 50-period SMA, which may act as a resistance zone in the near term. An important support level for the stock is at AUD 0.266, while the key resistance level is at AUD 0.325.
Individuals can evaluate the stock based on the support and resistance levels provided in the report in case of keen interest, taking into consideration the risk-reward scenario.
Considering the company's current price levels have facing resistance and momentum indicator analysis, a 'Watch' recommendation has been given on the stock. The stock was analysed as per the closing price of AUD 0.295 per share as of 31st October 2022.
Daily Technical Chart – ARU
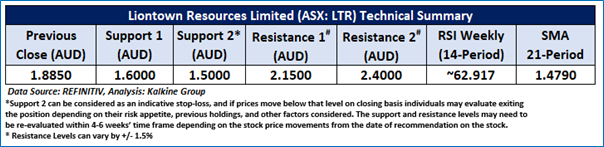
Liontown Resources Limited (ASX: LTR)
Liontown Resources Limited is a battery metals exploration and development company focused on developing its Kathleen Valley project to a standalone mine, in Australia.
Final Permits Sought: On October 3, 2022, LTR received approval from the WA Department of Mines, Industry, Regulation and Safety to commence major site operations at its Kathleen Valley project. It had also received approval from the WA Department of Water and Environmental Regulation. These are the final permits required to commence the site development activities. Commissioning activities at Kathleen Valley are targeted by the end of 2QFY24.
Expected Production: LTR is expecting to deliver the initial 500ktpa of spodumene concentrate to international markets. And later, it plans to ramp up to 700ktpa over the next six years. LTR already roped offtake contracts with key international customers, including LG Energy Solutions, Tesla and Ford, for the supply of spodumene concentrates.
Resources Estimates and Cash Balance: As per the resources estimates, Kathleen Valley holds 156mn tonnes of resources, with lithium oxide representing 1.4% and titanium oxide at 130ppm. As of September 30, 2022, LTR holds a cash balance of AUD 419.85mn.
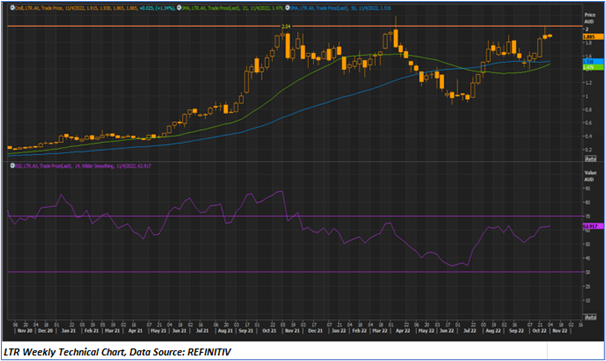
Technical Analysis: On the weekly chart, LTR prices are trading below the horizontal trendline and facing the resistance of the same. Moreover, the momentum oscillator RSI (14-period) is showing a reading of ~62.91 level and showing sign of weakness. However, the prices are trading below the trend-following indicators 21- period SMA, which may act as support zone. An important support level for the stock is placed at AUD 1.600 while the key resistance level is placed at AUD 2.150.
Individuals can evaluate the stock based on the support and resistance levels provided in the report in case of keen interest taking into consideration the risk-reward scenario.
Considering the company’s current price levels facing resistance at the falling trend line, momentum oscillator analysis, a ‘Watch’ recommendation is given on the stock. The stock was analysed as per the closing price of AUD 1.885 per share, as on 31st October 2022, up ~1.344%.
Weekly Technical Chart – LTR
Note 1: Past performance is neither an Indicator nor a guarantee of future performance.
Note 2: Investment decision should be made depending on an individual’s appetite for upside potential, risks, and any previous holdings. This recommendation is purely based on technical analysis, and fundamental analysis has not been considered in this report.
Note 3: Related Risks: This report may be looked at from high-risk perspective. Recommendations provided in this report are solely based on technical parameters, and the fundamental performance of the stocks has not been considered in the decision-making process. Other factors which could impact the stock prices include market risks, regulatory risks, interest rates risks, currency risks, social and political instability risks etc.
Technical Indicators Defined: -
Support: A level at which the stock prices tend to find support if they are falling, and a downtrend may take a pause backed by demand or buying interest. Support 1 refers to the nearby support level for the stock and if the price breaches the level, then Support 2 may act as the crucial support level for the stock.
Resistance: A level at which the stock prices tend to find resistance when they are rising, and an uptrend may take a pause due to profit booking or selling interest. Resistance 1 refers to the nearby resistance level for the stock and if the price surpasses the level, then Resistance 2 may act as the crucial resistance level for the stock.
Stop-loss: It is a level to protect further losses in case of unfavourable movement in the stock prices.
The Green colour line reflects the 21-period moving average. SMA helps to identify existing price trends. If the prices are trading above the 21-period, prices are currently in a bullish trend (Vice – Versa).
The Blue colour line reflects the 50-period moving average. SMA helps to identify existing price trends. If the prices are trading above the 50-period, prices are currently in a bullish trend (Vice – Versa).
The Orange colour line represents the Trendline.
The Purple colour line in the chart’s lower segment reflects the Relative Strength Index (14-Period), which indicates price momentum and signals momentum in trend. A reading of 70 or above suggests overbought status, while a reading of 30 or below suggests an oversold status.
Disclaimer
This report has been issued by Kalkine Pty Limited (ABN 34 154 808 312) (Australian financial services licence number 425376) (“Kalkine”) and prepared by Kalkine and its related bodies corporate authorised to provide general financial product advice. Kalkine.com.au and associated pages are published by Kalkine.
Any advice provided in this report is general advice only and does not take into account your objectives, financial situation or needs. You should therefore consider whether the advice is appropriate to your objectives, financial situation and needs before acting upon it.
There may be a Product Disclosure Statement, Information Statement or other offer document for the securities or other financial products referred to in Kalkine reports. You should obtain a copy of the relevant Product Disclosure Statement, Information Statement or offer document and consider the statement or document before making any decision about whether to acquire the security or product.
You should also seek advice from a financial adviser, stockbroker or other professional (including taxation and legal advice) as necessary before acting on any advice in this report or on the Kalkine website. Not all investments are appropriate for all people.
The information in this report and on the Kalkine website has been prepared from a wide variety of sources, which Kalkine, to the best of its knowledge and belief, considers accurate. Kalkine has made every effort to ensure the reliability of information contained in its reports, newsletters and websites. All information represents our views at the date of publication and may change without notice.
Kalkine does not guarantee the performance of, or returns on, any investment. To the extent permitted by law, Kalkine excludes all liability for any loss or damage arising from the use of this report, the Kalkine website and any information published on the Kalkine website (including any indirect or consequential loss, any data loss or data corruption). If the law prohibits this exclusion, Kalkine hereby limits its liability, to the extent permitted by law, to the resupply of services.
Please also read our Terms & Conditions and Financial Services Guide for further information.
On the date of publishing this report (referred to on the Kalkine website), employees and/or associates of Kalkine and its related entities do not hold interests in any of the securities or other financial products covered on the Kalkine website unless those persons comply with certain safeguards, procedures, and disclosures.
Kalkine Media Pty Ltd, an affiliate of Kalkine Pty Ltd, may have received, or be entitled to receive, financial consideration in connection with providing information about certain entity(s) covered on its website.
 AU
AU
 Please wait processing your request...