Expedia Group, Inc.
.png)
EXPE Details
Reported 9% y-o-y Top-line Growth: Expedia Group, Inc. (NASDAQ: EXPE) is an online travel company which has its own travel platform and aims to provide travel-details and travel related services to the consumers.
Q3FY19 Operational Highlights for the Period ended 30 September 2019: Expedia Group, Inc. declared its quarterly results, wherein the company reported revenue of $3,558 million as compared to $3,276 million in Q3FY18, driven by 9% growth in gross bookings which came in at $26,927 million. Operating income and net income declined by 9% and 22% on y-o-y basis at $609 million and $409 million, respectively. Selling and marketing expense stood at $1,600 million, up 11% on y-o-y basis, representing 46.7% of the total revenue. Technology and content expense came in at $440 million as compared to $404 million in previous corresponding period. As on 30 September 2019, the business reported more than 1.4 million properties available on its core lodging platform.
.png)
Q3FY19 Income Statement Highlights (Source: Company Reports)
Balance Sheet Highlights: The company reported cash, cash equivalents, restricted cash and short-term investments at $4.9 billion as on September 30, 2019. The company reported intangible assets and goodwill at $1,843 million and $8,104 million, respectively. Total assets were reported at $21,381 million at the end of Q3FY19.
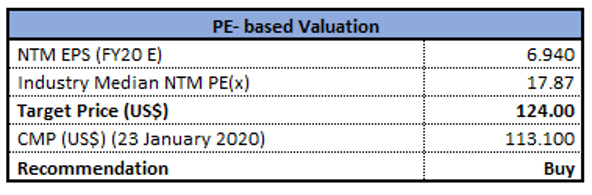
Valuation Methodology: Price to Earnings Multiple Approach
.png)
Price to Earnings Based Valuation (Source: Thomson Reuters)
Note: All forecasted figures and peers have been taken from Thomson Reuters, NTM-Next Twelve Months
Stock Recommendation: The stock of EXPE closed at $113.73 with a market capitalization of ~$16.47 billion. The stock is currently quoting below the average of its 52-week high-low of $144 and $93.53. The stock has generated negative returns of 17.71% and 2.50% in the last six months and one year, respectively. The group is focusing on expanding its global presence by leveraging substantial investments across technology, operations, brand building and supplier relationships.Considering the aforesaid facts, we have valued the stock using a relative valuation method, i.e., price to earnings multiple. For the matter,we have taken the peer group - Booking Holdings Inc (NASDAQ: BKNG), TripAdvisor Inc (NASDAQ:TRIP), Trip.com Group Ltd (NASDAQ: TCOM), etc., and arrived at a target price of lower double-digit upside (in % terms). Hence, we recommend a “Buy” rating on the stock at the closing price of $113.73, up 3.36% as on 23 January 2020.
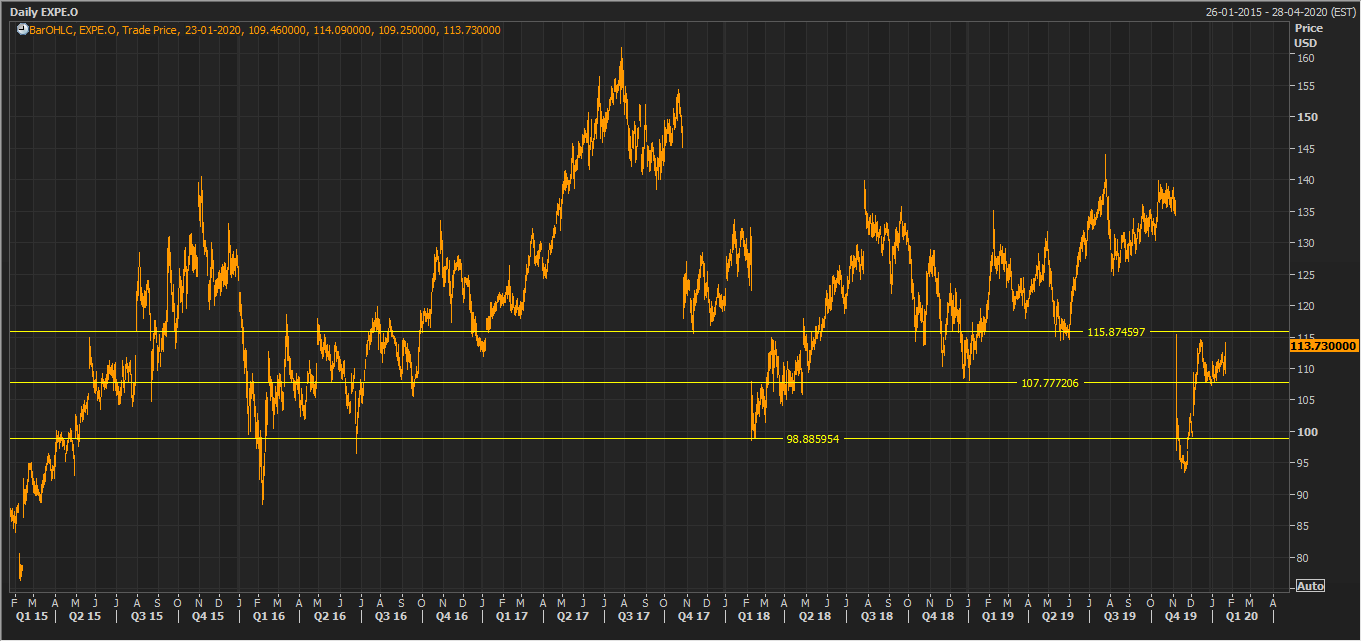
EXPE Daily Technical Chart (Source: Thomson Reuters)
Chevron Corporation
.png)
CVX Details
Targets a Spending Program of $20 billion for FY20: Chevron Corporation (NYSE: CVX) operates in the integrated energy segment and produces and transports crude oil and natural gas. The business is also engaged in refining, marketing and distribution activities of fuels and lubricants. Recently, the company made an announcement of an organic capital and exploratory spending program worth $20 billion in FY20. The latest budget program aims for a strong portfolio of both upstream and downstream investments. The above program comprises operation across its major capital project at TCO in Kazakhstan and in the Permian Basin, followed by a queue of deepwater prospects across the Gulf of Mexico.
Q3FY19 Operational Highlights for the Period ended 30 September 2019: CVX announced its quarterly results, wherein the company reported total revenues and other income at $36,116 million as compared to $43,987 million in the previous corresponding quarter. Net income stood at $2,580 million as compared to $4,047 million in Q3FY18. The company reported capital and exploratory expenditures of $15.0 billion in the first nine months of FY19 as compared with $14.3 billion in the previous corresponding period.Cash flow from operations for the first nine months of FY19 stood at $21.7 billion, up marginally from $21.5 billion reported in the previous corresponding period.
.png)
Q3FY19 Income Statement Highlights (Source: Company Reports)
Valuation Methodology: Price to Earnings Multiple Approach
Price to Earnings Based Valuation (Source: Thomson Reuters)
Note: All forecasted figures and peers have been taken from Thomson Reuters, NTM-Next Twelve Months
Stock Recommendation: The stock of CVX closed at $113.10 with a market capitalization of ~$213.85 billion. The stock is currently quoting at the lower band of its 52-week trading range of $110.42 to $127.34. The stock has generated negative return 3.81% and 9.97% in the last three months and six months, respectively. In order to deliver strong shareholder’s return, the business intends to invest across the privileged assets. Considering the aforesaid facts, we have valued the stock using a relative valuation method, i.e., price to earnings multiple. For the matter,we have taken the peer group - Exxon Mobil Corp (NASDAQ: XOM), ConocoPhillips (NASDAQ: COP), Marathon Oil Corp (NASDAQ: MRO), etc., and arrived at a target price of lower double-digit growth (in % terms). Hence, we recommend a “Buy” rating on the stock at the closing price of $113.10, up 0.18% as on 23 January 2020.
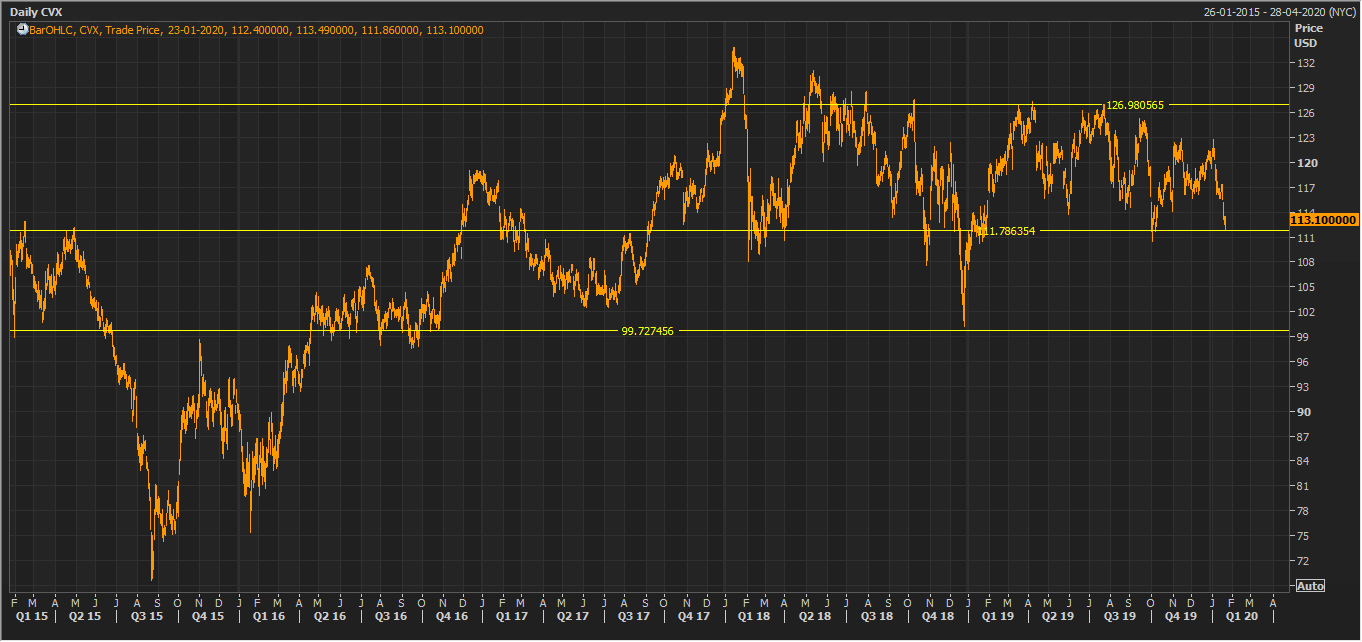
CVX Daily Technical Chart (Source: Thomson Reuters)
Disclaimer
The advice given by Kalkine Pty Ltd and provided on this website is general information only and it does not take into account your investment objectives, financial situation or needs. You should therefore consider whether the advice is appropriate to your investment objectives, financial situation and needs before acting upon it. You should seek advice from a financial adviser, stockbroker or other professional (including taxation and legal advice) as necessary before acting on any advice. Not all investments are appropriate for all people. Kalkine.com.au and associated pages are published by Kalkine Pty Ltd ABN 34 154 808 312 (Australian Financial Services License Number 425376). The information on this website has been prepared from a wide variety of sources, which Kalkine Pty Ltd, to the best of its knowledge and belief, considers accurate. You should make your own enquiries about any investments and we strongly suggest you seek advice before acting upon any recommendation. Kalkine Pty Ltd has made every effort to ensure the reliability of information contained in its newsletters and websites. All information represents our views at the date of publication and may change without notice. To the extent permitted by law, Kalkine Pty Ltd excludes all liability for any loss or damage arising from the use of this website and any information published (including any indirect or consequential loss, any data loss or data corruption). If the law prohibits this exclusion, Kalkine Pty Ltd hereby limits its liability, to the extent permitted by law to the resupply of services. There may be a product disclosure statement or other offer document for the securities and financial products we write about in Kalkine Reports. You should obtain a copy of the product disclosure statement or offer document before making any decision about whether to acquire the security or product. The link to our Terms & Conditions has been provided please go through them and also have a read of the Financial Services Guide. On the date of publishing this report (mentioned on the website), employees and/or associates of Kalkine Pty Ltd do not hold positions in any of the stocks covered on the website. These stocks can change any time and readers of the reports should not consider these stocks as advice or recommendations.
 AU
AU

 Please wait processing your request...