Dropbox, Inc.
.png)
DBX Details
Reported Growth in Average Revenue Per User: Dropbox, Inc. (NASDAQ: DBX) is a cloud-based information technology company which provides smart workplace to its users where they can share their own files and folders.
Q3FY19 Operational Highlights for the Period ended 30 September 2019:DBX declared its quarterly report, wherein the company reported total revenue of $428.2 million, depicting an increase of 19% on y-o-y basis, driven by modest growth in total paying users. The company reported average revenue per user at $123.15 as compared to $118.6 in the previous corresponding period. The company reported gross margin at 76.7% as compared to 75.9% in the previous corresponding period. Free cash flow, during the quarter, stood at $102.5 million as compared to $120.0 million in the previous corresponding quarter. The company reported research and development expenses at $172.8 million as compared to $133.2 million in Q3FY18. Sales and marketing expense stood at $108.2 million, increased from $95 million in the previous corresponding period. The company reported a net loss of $17 million as compared to $5.8 million in the previous corresponding period.
.png)
Q3FY19 Income Statement Highlights (Source: Company Reports)
Guidance:The Management expects Q4FY19 revenue within the range of $442 million to $444 million. DBX expects its operating margin (Non-GAAP) to be in the range of 14% to 15%. FY19 full-year revenue is expected within $1,657 million to $1,659 million. Non-GAAP operating margin is expected at around 12%. Free cash flow for the year is expected in between $375 million and $385 million.
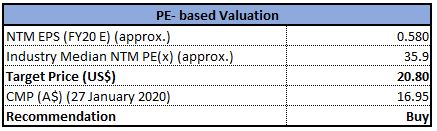
Valuation Methodology: Price to Earnings Multiple Approach
Price to Book value Based Valuation (Source: Thomson Reuters)
Note: All forecasted figures and peers have been taken from Thomson Reuters, NTM-Next Twelve Months
Stock Recommendation:The stock of DBX is quoting at $16.95 with a market capitalization of $7.039 billion. The stock is trading at the lower band of its 52-week trading range of $16.08 to $26.49. The business witnessed strong top-line growth with margin-expansion in Q3FY19 and delivered strong momentum within the new desktop application. Considering the above factors, we have valued the stock using one relative valuation method, i.e., Price to earnings multiple and arrived at a target price with lower double-digit upside (in % terms). Hence, we give a “Buy” rating on the stock at the current market price of $16.95 per share, down by 2.25% on 27 January 2020.
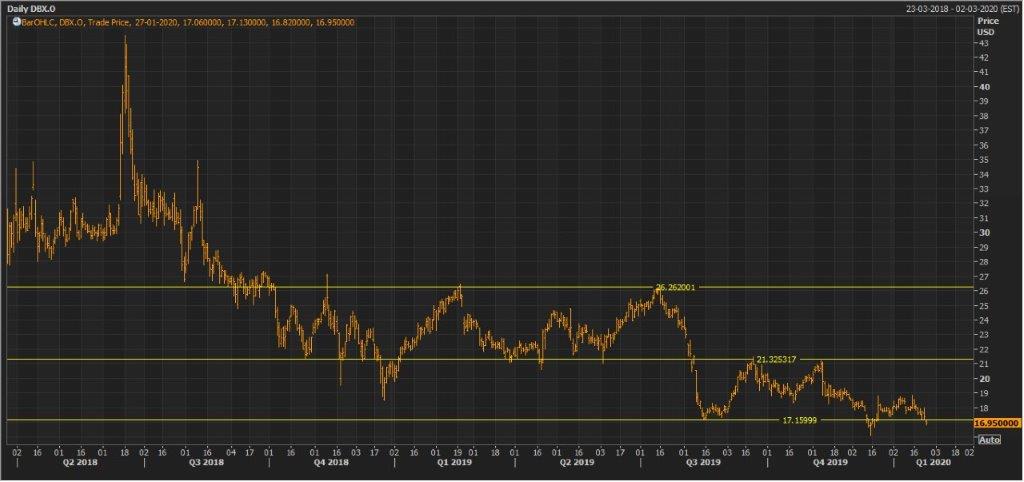
DBX Daily Price Chart (Source: Thomson Reuters)
Macy’s, Inc.
.png)
M Details
Improved Customer Experience Led to Business Prospect: Macy’s, Inc. (NASDAQ: M) is a retail-based company which operates in department stores and has ~680 stores under its brand name.
Q3FY19 Operational Highlights for the Period ended 02 November 2019: Macy’s announced its quarterly reports, wherein the company reported net sales at $5,173 million as compared to $5,404 million in the previous corresponding period. The company reported cost of sales at $3,106 million as compared to $3,226 million in Q3FY18. Selling, general and administrative expenses stood at $2,202 million as compared to $2,255 million in the previous corresponding period. Net income came in at $2 million as compared to $62 million in the previous corresponding period.
.png)
Q3FY19 Income Statement Highlights (Source: Company Reports)
Outlook: The company expects a decline of 2% to 2.5% in FY19 net sales from FY18. Comparable sales (owned plus licensed) is likely to see a y-o-y de-growth of 1.5% to 1% in FY19. The business expects adjusted Diluted earnings per share for FY19 within the range of $2.57 to $2.77. The company expects Asset sale gains of approximately $150 million for FY19 while the annual tax rate is expected at 23%.
Stock Recommendation:The stock of M is quoting at $16.38 with a market capitalization of $5.06 billion. The stock is trading at the lower band of its 52-week trading range of $14.11 to $26.48. The business is committed to deliver an improved experience for the customers across the stores, across digital sites and through the mobile application. The company curated additional gift assortment with great values across categories and provided customized services to its customers. The stock is available at an Enterprise value to Sales multiple of 0.4x on TTM basis as compared to the industry median (Consumer Cyclicals) of 1.2x. On a price to earnings multiple basis, the stock is available at 5.28x on TTM basis as compared to the industry median (Consumer Cyclicals) of 10.8x. Considering the recent trading levels, valuations and business prospects, we recommend a “Buy” rating on the stock at the current market price of $16.38 per share, down 2.38% on 27 January 2020.
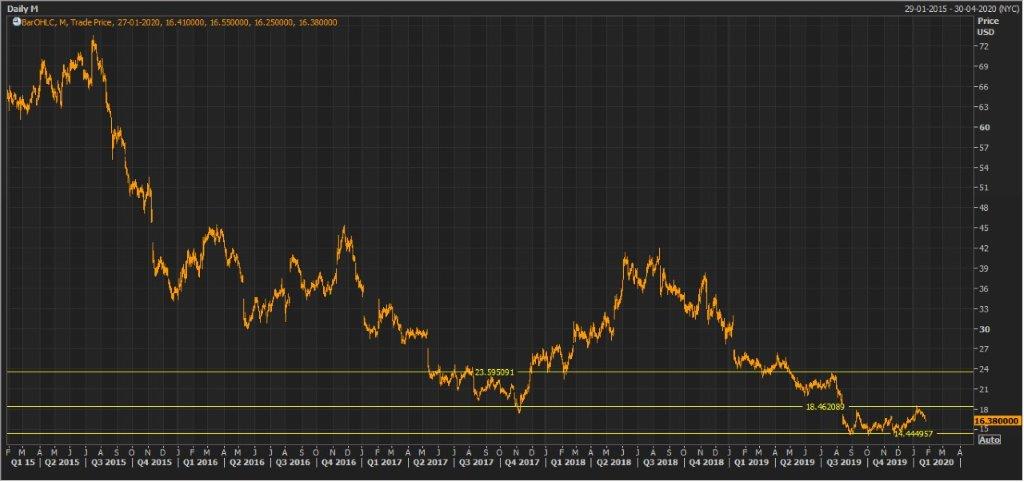
M Daily Price Chart (Source: Thomson Reuters)
Disclaimer
The advice given by Kalkine Pty Ltd and provided on this website is general information only and it does not take into account your investment objectives, financial situation or needs. You should therefore consider whether the advice is appropriate to your investment objectives, financial situation and needs before acting upon it. You should seek advice from a financial adviser, stockbroker or other professional (including taxation and legal advice) as necessary before acting on any advice. Not all investments are appropriate for all people. Kalkine.com.au and associated pages are published by Kalkine Pty Ltd ABN 34 154 808 312 (Australian Financial Services License Number 425376). The information on this website has been prepared from a wide variety of sources, which Kalkine Pty Ltd, to the best of its knowledge and belief, considers accurate. You should make your own enquiries about any investments and we strongly suggest you seek advice before acting upon any recommendation. Kalkine Pty Ltd has made every effort to ensure the reliability of information contained in its newsletters and websites. All information represents our views at the date of publication and may change without notice. To the extent permitted by law, Kalkine Pty Ltd excludes all liability for any loss or damage arising from the use of this website and any information published (including any indirect or consequential loss, any data loss or data corruption). If the law prohibits this exclusion, Kalkine Pty Ltd hereby limits its liability, to the extent permitted by law to the resupply of services. There may be a product disclosure statement or other offer document for the securities and financial products we write about in Kalkine Reports. You should obtain a copy of the product disclosure statement or offer document before making any decision about whether to acquire the security or product. The link to our Terms & Conditions has been provided please go through them and also have a read of the Financial Services Guide. On the date of publishing this report (mentioned on the website), employees and/or associates of Kalkine Pty Ltd do not hold positions in any of the stocks covered on the website. These stocks can change any time and readers of the reports should not consider these stocks as advice or recommendations.
 AU
AU

 Please wait processing your request...