Syrah Resources Limited
Production and recovery on rise: Syrah Resources Limited (ASX: SYR) is an Australian-based mining explorer company with a market capitalisation of ~A$395.94 Mn as of 28 May 2019. Recently, the company has presented its business prospects at the Managing Director's presentation and highlighted FY18 activity and its outlook. As per the presentation, the company achieved accreditation of ISO 14001:2015 & OHSAS 18001:2007 in May 2018. With respect to health & safety, the malaria screening program has been proved, effective with more than 6,000 screening tests along with 444 averted cases since the program had started in September 2018. The company had finalized the binding agreement with the Government of Mozambique.
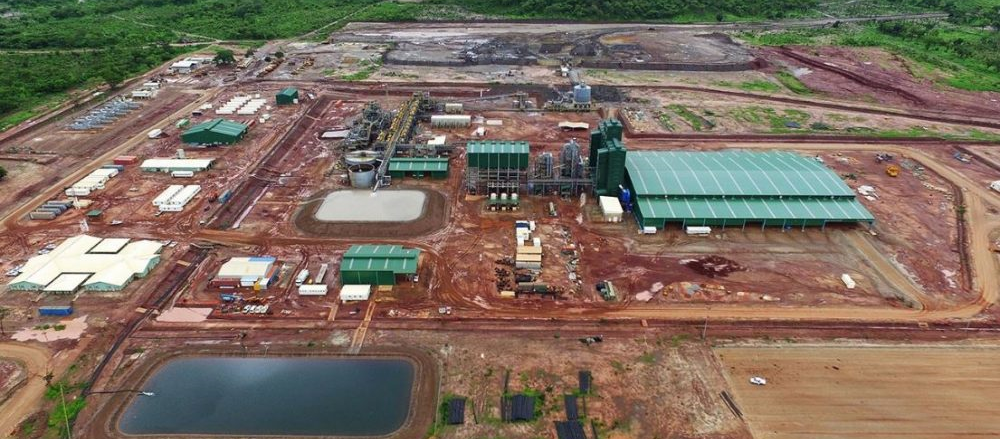
Balama had become a world’s major producer in the first year of its commencement. It had achieved plant peak daily throughput capacity of approximately pro rata 2Mt per annum feed. The average graphite recovery has been improved to 70% in Q4 along with the achievement of 90% in peak daily recovery. In FY18, Balama Plant had successfully produced 98% fixed carbon graphite in coarse flake circuit by using standard flotationprocesses.
.png)
Production and Recovery (Source: Company Reports)
The cash flow of Balama has been impacted by the slower than expected realisation of working capital with improved sales volumes which are occurring later than planned and impact of operational performance. The cash balance of the company stood at US$62Mn as at 31st March 2019. The Balama’s overall operating cost structure has been developed in accordance with SYR’s expectations in FY18.
Moreover, the company had undertaken more extensive engagement for the development of debt funding, and it continues to evaluate the options.
What to Expect from SYR: The company would continue to review and manage the trade off between additional supply by increasing its production volumes and realised prices to ensure that margin and cash impacts are optimised.
With respect to the market conditions, SYR had anticipated the production target of approximately 250kt for FY2019.With respect to Battery Anode Material (BAM) project, the purified spherical graphite customer qualification product dispatch has been scheduled for Q3FY19.
Stock Recommendation: The C1 cash operating costs are moving towards the level of US$400 per tonne during FY19 through production volume increase and structural cost management.
The current ratio of the company stood at 5.02x in FY 2018 in comparison to the industry median of 1.67x, which represents that the company is in a decent position to address its short-term obligations as compared to the broader industry. With respect to stock’s performance, it had offered a return of -18.44% and -27.90% in the time span of three months and six months, respectively. As per the Australian Securities and Investments Commission (ASIC) report, the short position for SYR’s share was reported at ~15.78% as on May 22, 2019. Hence, considering the aforesaid facts and decent outlook, we give a “Speculative Buy” recommendation on the stock at the current market piece of A$1.130 per share (down 1.739% on 28 May 2019).
JB Hi-Fi Limited
Trading at Higher Levels: JB Hi-Fi Limited (ASX: JBH) is a specialty retailer of home consumer products with a primary focus on consumer electronics, software, whitegoods and appliances with a market capitalisation of around A$3.21 billion (as at 28 May 2019). The company recently presented its business prospects at the Macquarie Australia Conference and highlighted about trading and FY19 outlook. As per the presentation, the company runs a low-cost operating model wherein cost of doing business accounted for 15.4% of the major Australian listed retailers and international consumer electronics retailers. Moreover, it allows the company to maintain consistentlylow prices and ability to respond towards market price activity and to maintain its focus on market share.Additionally, it also provides with the ability to compete effectively with traditional competitors and new participants of the market.
.png)
Cost operating model comparison (Source: Company Reports)
In the context of sales number for JB HI-FI Australia, the company witnessed a rise of 2.6% in Q3FY19 in comparison to 7.5% in Q3FY18 with comparable sales growth of 1.5% in Q3FY19 in comparison to 4.3% in Q3FY18.
Whereas in New Zealand, the total sales growth was -1.2% in Q3FY19 in comparison to -4.4% in Q3FY18. However, with respect to The Good Guys, total sales growth was 2.2% in Q3 FY 2019 while in Q3 FY 2018 it was -1.3%.
Future Aspects: The company anticipates sales of around $7.1Bn, which will comprise JB HI-FI Australia and New Zealand sales of $4.73bn and NZD$0.24 billion, respectively in FY19. While The Good Guys is expected to post sales amounting to $2.15 billion.
Moreover, for FY19, JBH expects group NPAT in the range of $237 Mn-$245 Mn, displaying an increase of 1.6% to 5.1% on the pcp basis.JBH is focused on driving its sales in store, online and commercial. The company is planning to design and implement the expanded services offer. Adding to that, trial of TV install service offering was completed in January 2019.
Stock Recommendation: The company is focused on the implementation of a group wide entry level Television offer and to enhance a supplier engagementin FY20.Additionally, it is focused on developing brand awareness and strengthen supplier partnerships.
The return on equity stood at 16.0% in 1HFY19 in comparison to the industry median of 6.7%, which implies that the company is providing better returns to its shareholders in comparison to its peer group. With respect to stock’s past performance, it had witnessed a rise of 7.92% and 30.47% in the time span of one-month and three months, respectively. The stock is trading towards its 52 weeks higher levels of $28.370. As per ASIC or Australian Securities and Investment Commission, as on 22 May 2019, the stock was shorted over 15.43%. Hence, considering the aforesaid facts and current trading level, we give an “Expensive” recommendation on the stock at the current market price of A$28.28 per share (up 1.289% on 28 May 2019).
Disclaimer
The advice given by Kalkine Pty Ltd and provided on this website is general information only and it does not take into account your investment objectives, financial situation or needs. You should therefore consider whether the advice is appropriate to your investment objectives, financial situation and needs before acting upon it. You should seek advice from a financial adviser, stockbroker or other professional (including taxation and legal advice) as necessary before acting on any advice. Not all investments are appropriate for all people. Kalkine.com.au and associated pages are published by Kalkine Pty Ltd ABN 34 154 808 312 (Australian Financial Services License Number 425376). The information on this website has been prepared from a wide variety of sources, which Kalkine Pty Ltd, to the best of its knowledge and belief, considers accurate. You should make your own enquiries about any investments and we strongly suggest you seek advice before acting upon any recommendation. Kalkine Pty Ltd has made every effort to ensure the reliability of information contained in its newsletters and websites. All information represents our views at the date of publication and may change without notice. To the extent permitted by law, Kalkine Pty Ltd excludes all liability for any loss or damage arising from the use of this website and any information published (including any indirect or consequential loss, any data loss or data corruption). If the law prohibits this exclusion, Kalkine Pty Ltd hereby limits its liability, to the extent permitted by law to the resupply of services. There may be a product disclosure statement or other offer document for the securities and financial products we write about in Kalkine Reports. You should obtain a copy of the product disclosure statement or offer document before making any decision about whether to acquire the security or product. The link to our Terms & Conditions has been provided please go through them and also have a read of the Financial Services Guide. On the date of publishing this report (mentioned on the website), employees and/or associates of Kalkine Pty Ltd do not hold positions in any of the stocks covered on the website. These stocks can change any time and readers of the reports should not consider these stocks as advice or recommendations.
 AU
AU
 Please wait processing your request...