Resimac Group Ltd
.png)
RMC Details
NPAT Reports Exuberant Growth on PCP: Resimac Group Ltd (ASX: RMC) is a leading non-bank residential mortgage lender and multi-channel distributor across Australia and New Zealand. On 12 December 2019, RMC announced its 60% acquisition in IA Group at a price consideration of $6 million effective from 01 January 2019.
FY19 Highlights for the Period Ended 30 June 2019: RMC declared its full-year results, wherein the company reported net interest income of $117.9 million, up 15% on y-o-y basis, driven by 19% principally funded AUM growth, partly offset by lower margins. The company reported statutory NPAT at $47.2 million as compared to $25.3 million in FY18, depicting an 86% growth on y-o-y basis. Cost to income ratio on normalized basis stood at 56.6% in FY19 as compared to 61.7% in FY18. The business reported return on equity on normalized NPAT basis at 17.3%. The company reported lower H2FY19 settlements, however, Q4 settlements increased materially, providing strong momentum into FY20. During the year, the company reported higher net fees and commission, driven by higher RMBS funding fees and higher broker commissions on a larger principally funded portfolio. Loan impairment expense increased by $1.4 million, aided by impairments of $0.9 million in the acquired legacy book, and small increases of $0.5 million across the portfolio.
Guidance: For H1FY20, the company expects normalized NPAT in the range of $24 million to $27 million which includes lower Q1 funding costs driven by the relatively low spreads between RBA Cash Rate and 30-day BBSW and continued strong Assets Under Management growth. The company also informed that change in spreads between RBA Cash Rate and 30-day BBSW during Q2FY20 has increased its funding costs.
Valuation Methodology:Price to Book Value based Valuation
.png)
Price to Book Value Based Valuation (Source: Thomson Reuters)
Note: All forecasted figures and peers have been taken from Thomson Reuters, *NTM-Next Twelve Months
Stock Recommendation: The stock of RMC is trading at $1.180 with a market capitalization of ~$487.89 million. The stock has generated exponential returns of 88.62% and 151.50% in the last six months and one year, respectively. At the current market price, the stock is trading at the upper band of its 52-week trading range of $0.442 and $1.30. Considering the above factors, we are of the view that most of the positive factors have been discounted at the current juncture. Hence, we have valued the company using price to book value based relative valuation method and arrived at a single-digit downside in percentage terms. Therefore, we give a “Sell” rating on the stock at the current market price of $1.18, down 1.667% on 13 December 2019.
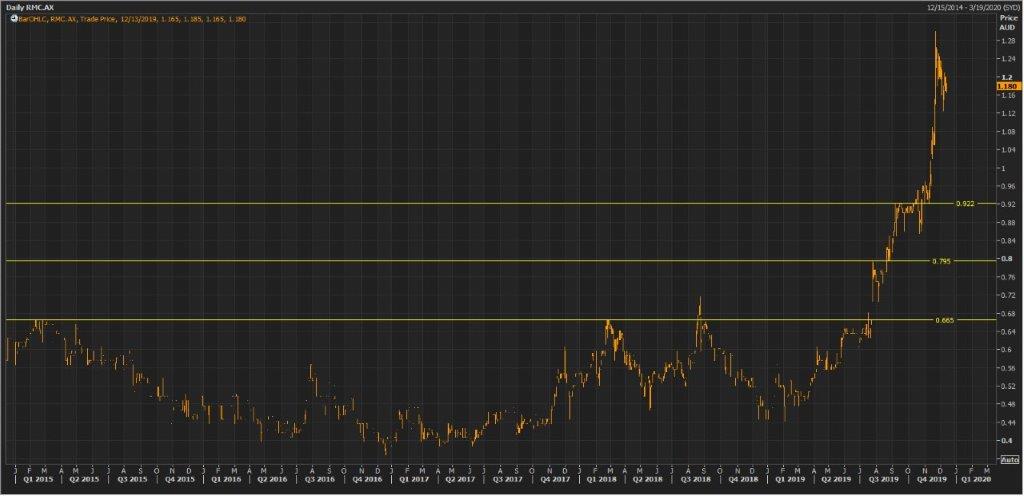
RMC Daily Technical Chart (Source: Thomson Reuters)
Kathmandu Holdings Limited
.png)
KMD Details
KMD’s Stock Operating at High Levels: Kathmandu Holdings Limited (ASX: KMD) operates as a retailer of clothing and equipment for travel and adventure. As per a recent market update, the voting power of Jarden Partners Limited went up from 10.712% to 12.021%.
FY19 Highlights for the Period Ended 30 June 2019: KMD announced its FY19 results, wherein, the company reported sales at NZ$545.6 million, up 9.7% on y-o-y basis. NPAT came in at NZ$57.6 million, up 13.7% on y-o-y basis, aided by 9.2% y-o-y growth in online sales at constant exchange rates and 30% y-o-y sales growth in Oboz segment. The company reported EBIT at NZ$84.3 million, up 12.7% on y-o-y basis. Online sales came in at NZ$48.4 million, which now comprise 10.1% of direct to consumer sales. KMD reported FY19 sales from North America at NZ$64.0 million followed by an EBIT of NZ$9.6 million. During the period, the business launched the first global brand campaign ‘World Ready’ and reported 12% y-o-y increase in social media and digital reach.
Outlook: As per the FY20 outlook, the management believes that Rip Curl is well-positioned for the summer trading period. Moreover, the business expects the H1FY20 result to be highly dependent on the Christmas trading period.
Valuation Methodology:Enterprise Value to Sales Multiple based Approach
.png)
Enterprise Value to Sales Based Valuation (Source: Thomson Reuters), (*1 NZD = 0.96 AUD)
Note: All forecasted figures and peers have been taken from Thomson Reuters, *NTM-Next Twelve Months
Recommendation: The stock of KMD is quoting at $3.020, with a market capitalization of ~$875.25 million. The stock has generated 27.06% and 48.65% returns in the last three months and six months, respectively. Currently, the stock is trading at the upper band of its 52-week trading range of $1.896 to $3.050. Considering the aforesaid facts, we have valued the stock using the Enterprise Value to Sales based relative valuation method and arrived at a target price of lower double-digit downside (in % terms). Looking at the current trading levels and price movements, we are of the view that most of the positives have been discounted at the current juncture. Hence, we suggest investors to book profit and recommend a “Sell” rating on the stock at the closing price of $3.020, up 1.684% as on 13 December 2019.
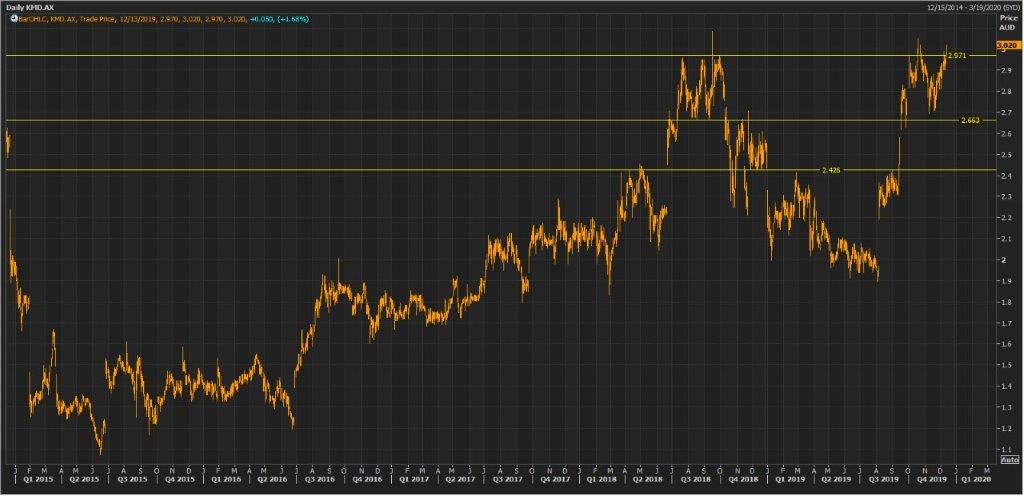
KMD Daily Technical Chart (Source: Thomson Reuters)
Disclaimer
The advice given by Kalkine Pty Ltd and provided on this website is general information only and it does not take into account your investment objectives, financial situation or needs. You should therefore consider whether the advice is appropriate to your investment objectives, financial situation and needs before acting upon it. You should seek advice from a financial adviser, stockbroker or other professional (including taxation and legal advice) as necessary before acting on any advice. Not all investments are appropriate for all people. Kalkine.com.au and associated pages are published by Kalkine Pty Ltd ABN 34 154 808 312 (Australian Financial Services License Number 425376). The information on this website has been prepared from a wide variety of sources, which Kalkine Pty Ltd, to the best of its knowledge and belief, considers accurate. You should make your own enquiries about any investments and we strongly suggest you seek advice before acting upon any recommendation. Kalkine Pty Ltd has made every effort to ensure the reliability of information contained in its newsletters and websites. All information represents our views at the date of publication and may change without notice. To the extent permitted by law, Kalkine Pty Ltd excludes all liability for any loss or damage arising from the use of this website and any information published (including any indirect or consequential loss, any data loss or data corruption). If the law prohibits this exclusion, Kalkine Pty Ltd hereby limits its liability, to the extent permitted by law to the resupply of services. There may be a product disclosure statement or other offer document for the securities and financial products we write about in Kalkine Reports. You should obtain a copy of the product disclosure statement or offer document before making any decision about whether to acquire the security or product. The link to our Terms & Conditions has been provided please go through them and also have a read of the Financial Services Guide. On the date of publishing this report (mentioned on the website), employees and/or associates of Kalkine Pty Ltd do not hold positions in any of the stocks covered on the website. These stocks can change any time and readers of the reports should not consider these stocks as advice or recommendations.
 AU
AU

 Please wait processing your request...