Scentre Group
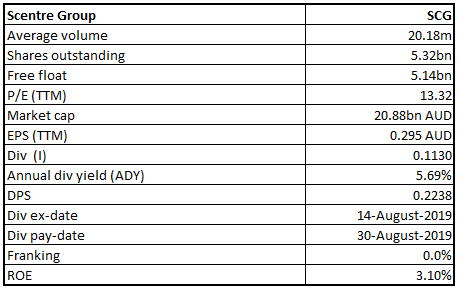
SCG Details
1H19 Results Demonstrate Long-term Growth:Scentre Group (ASX: SCG) owns and operates a retail property portfolio in Australia and New Zealand. As on 25 September 2019, the company bought back a total of 14,980,058 shares for a total consideration of A$58,978,288.66. Shares/Units worth A$741,021,711.34 are yet to be bought back out of the aggregate consideration of A$800,000,000.
1H19 Performance: During the six months ended 30 June 2019, the company reported revenue amounting to $1,302.9 million, representing an increase of 1.6% on prior corresponding period revenue of $1,282.2 million. Profit after tax for the period was reported at $740 million, that went down by 49.4% on pcp profit of $1,462.6 million. During the half, funds from operations attributable to member of the group stood at $676.2 million, up by 2.9% on pcp value of $657.2 million. Shareholders of the group were paid a dividend, amounting to 11.30 cents per stapled security on 30 August 2019.
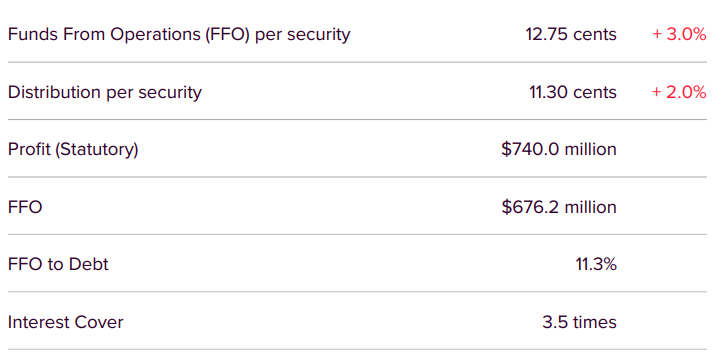
1H19 Results (Source: Company Reports)
Segment Performance: During the half, property investment segment reported revenue amounting to $1,194.9 million as compared to $1,157.7 million in prior corresponding year. Property management and construction revenue amounted to $185.0 million, against prior corresponding period revenue of $206.2 million.
Geographical Update: A large chunk of the property revenue for the period came from Australia, amounting to $1,144.4 million. New Zealand contributed revenue amounting to $50.5 million in the first half. Property development and construction revenue from New Zealand stood at $108.8 million and that from Australia amounted to $76.2 million.
Outlook: In FY19, FFO growth is expected to be around 0.7%, including the impact of the transactions announced in the first half. While forecasting the growth, the company did not take into account the positive impact of the security buy-back program, valued at around $800 million. The Group reconfirms the Distribution forecast for FY19 to come in at 22.60 cents per security, an increase of 2%.
Stock Recommendation: The stock of the company generated returns of 0.51% and 0.77% over a period of 1 month and 3 months, respectively. During the half, the group’s total annual sales increased to $24.4 billion with the company’s platform accounting for more than 7% of all retail sales in Australia. The group depicted strong financial position with FFO to Debt ratio of 11.3% and interest cover at 3.5 times. The group introduced 118 new brands during the half, with 117 existing brands growing the store network alongside. In addition, the group currently has $835 million total active developments underway and is on track for completion of Westfield Newmarket in Auckland in Q42019. The development of Westfield Newmarket will set a new benchmark retail, dining and entertainment. Considering the above factors, we give a “Buy” recommendation on the stock at the current market price of $3.980, up 1.272% on 25 September 2019.
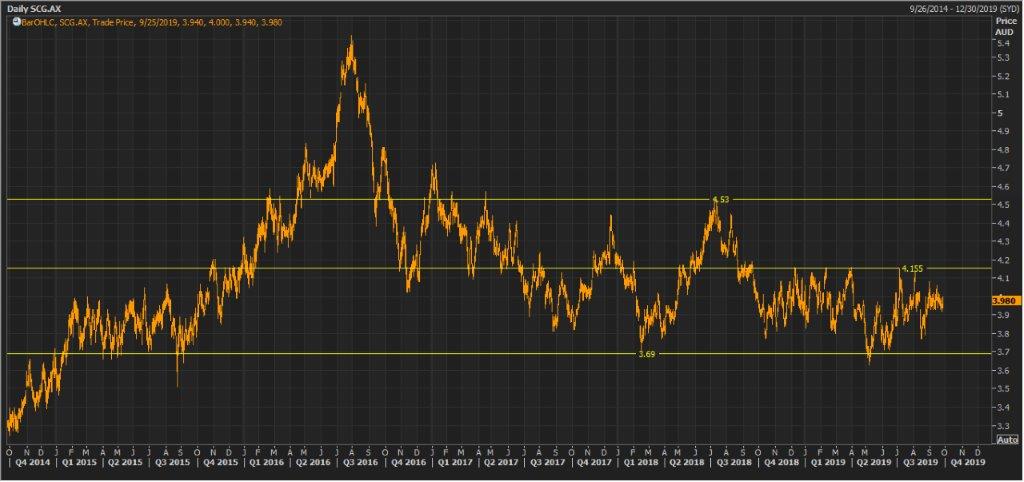
SCG Daily Technical Chart (Source: Thomson Reuters)
Telstra Corporation Limited
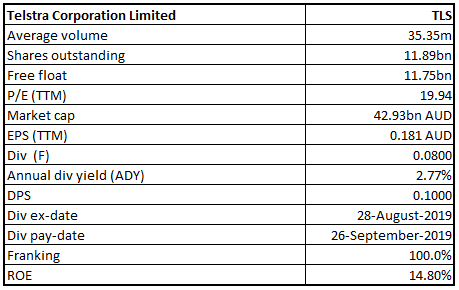
TLS Details
Updated Guidance for FY20:Telstra Corporation Limited (ASX: TLS) is engaged in the provision of telecommunications and information services for domestic and international customers. The company recently updated that it will be paying a total dividend amounting to 8 cents per share on 26 September 2019.
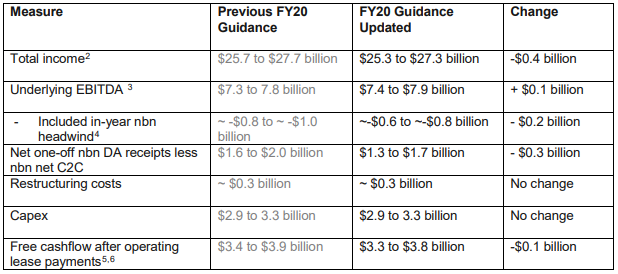
FY20 Guidance: The company recently updated the guidance for FY20, following the release of NBN Co’s Corporate Plan 2020. Total number of premises forecast to be connected during FY20 has been reduced to 1.5 million, as compared to the previous prediction of 2 million. The company no longer expects FY20 to be the year of peak nbn headwind and anticipates the same to occur in FY21.
As a result of the above change, the company revised the guidance provided for other financial metrics. Total income for FY20 is now expected to be in the range of $25.3 billion - $27.3 billion, as compared to the earlier guidance range of $25.7 billion - $27.7 billion. Underlying EBITDA for the year is expected to be in the range of $7.4 - $7.9 billion, as compared to previous guidance of $7.3 – $7.8 billion. Free cashflow after operating lease payment for FY20 is expected to be in the range of $3.3 - $3.8 billion, as compared to prior guidance range of $3.4 - $3.9 billion.
Revised FY20 Guidance (Source: Company Reports)
FY19 Results: In FY19, total income on reported basis stood at $27.8 billion, down 3.6% on prior corresponding year. EBITDA for the period was reported at $8.0 billion, down 21.7% on pcp. NPAT for the period was reported at $2.1 billion, down 39.6% on pcp basis.The period saw a reduction in the number of Consumer & Small Business fixed and mobile plans from 1800 to 20, offering customers with simplification.
Stock Recommendation:The stock of the company generated negative returns of 1.64% and 5.23% over a period of 1 month and 3 months, respectively. During the year, the company completed its strategic investment program announced in 2016 to digitise its business and create networks for the future, delivering EBITDA benefits of over $500 million. The period was also marked by the launch of 5G platform for future growth. Over the next 12 months, 5G coverage is expected to increase almost five-fold. In addition, the period began with the T22 strategy which reported significant progress during the year. Based on the above factors, we give a “Hold” recommendation on the stock at the current market price of $3.540, down 1.939% on 25 September 2019.
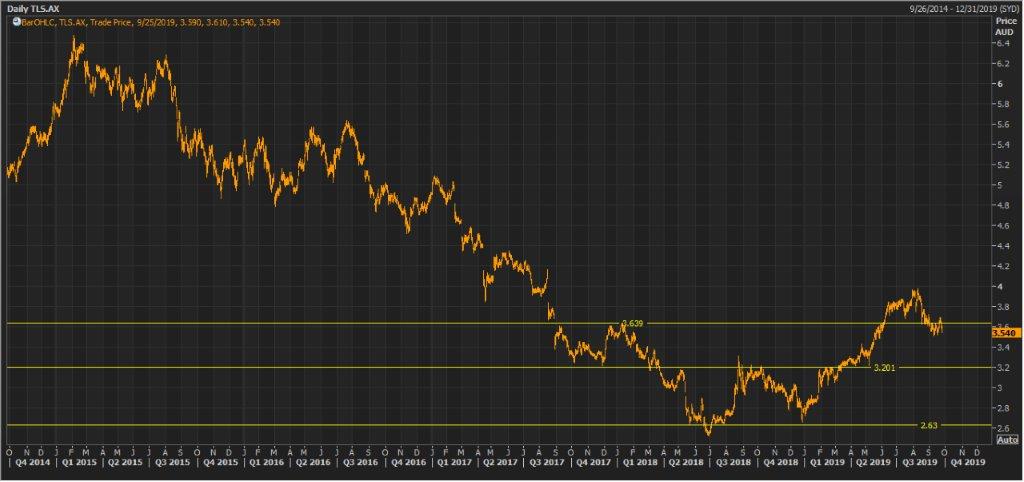
TLS Daily Technical Chart (Source: Thomson Reuters)
Disclaimer
The advice given by Kalkine Pty Ltd and provided on this website is general information only and it does not take into account your investment objectives, financial situation or needs. You should therefore consider whether the advice is appropriate to your investment objectives, financial situation and needs before acting upon it. You should seek advice from a financial adviser, stockbroker or other professional (including taxation and legal advice) as necessary before acting on any advice. Not all investments are appropriate for all people. Kalkine.com.au and associated pages are published by Kalkine Pty Ltd ABN 34 154 808 312 (Australian Financial Services License Number 425376). The information on this website has been prepared from a wide variety of sources, which Kalkine Pty Ltd, to the best of its knowledge and belief, considers accurate. You should make your own enquiries about any investments and we strongly suggest you seek advice before acting upon any recommendation. Kalkine Pty Ltd has made every effort to ensure the reliability of information contained in its newsletters and websites. All information represents our views at the date of publication and may change without notice. To the extent permitted by law, Kalkine Pty Ltd excludes all liability for any loss or damage arising from the use of this website and any information published (including any indirect or consequential loss, any data loss or data corruption). If the law prohibits this exclusion, Kalkine Pty Ltd hereby limits its liability, to the extent permitted by law to the resupply of services. There may be a product disclosure statement or other offer document for the securities and financial products we write about in Kalkine Reports. You should obtain a copy of the product disclosure statement or offer document before making any decision about whether to acquire the security or product. The link to our Terms & Conditions has been provided please go through them and also have a read of the Financial Services Guide. On the date of publishing this report (mentioned on the website), employees and/or associates of Kalkine Pty Ltd do not hold positions in any of the stocks covered on the website. These stocks can change any time and readers of the reports should not consider these stocks as advice or recommendations.
 AU
AU

 Please wait processing your request...