SunPower Corp
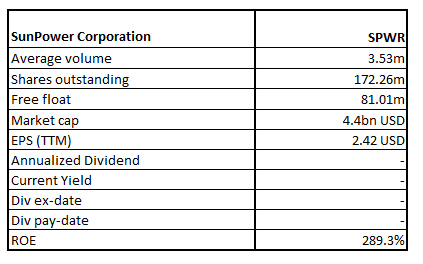
SPWR Details
SunPower Corp (NYSE: SPWR) is engaged in designing and manufacturing solar panels and systems for all-in-one residential and commercial solutions. The company has offices in North America, Europe, Australia, Africa and Asia.
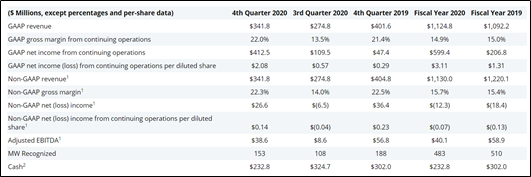
FY20 Results Performance (For the Fiscal Year Ended January 3, 2021)
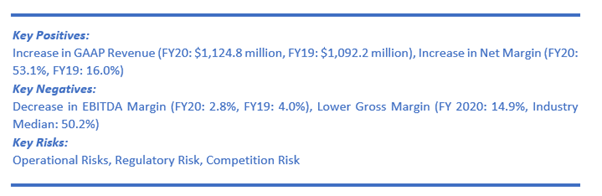
The company has recorded marginal growth in GAAP revenue during the period, up by 2.98% YoY to $1,124.8 million. The gross margin from continuing operations declined slightly to 14.9% from 15% in the previous year. However, the company witnessed significant growth in GAAP net income from continuing operations to $599.4 million from $206.8 million, representing 189.8% YoY growth.
Financial Snapshot (Source: Company Reports)
Repayment of Loan
The company on 15 April 2021 declared that it has repaid a loan worth $30 million with the California Enterprise Development Authority. Moreover, it is planning to pay the remaining of its outstanding 2021 convertible bond issue in Q2FY21.
Recent Update
The company on 18 March 2021 has announced a new loan facility for its residential solar and storage customers with interest rates remaining as low as 0.99% and 1.99% for a loan terms of 15 years and 25 years, respectively. This facility is towards availing its SunPower Equinox® system and SunVault™ battery storage.
Outlook
Given the backdrop of trend wherein businesses look to generate and store their own energy, there has been increased U. S. demand for the company’s products. The company is focused on those markets that offer strong growth potential. The company is well-positioned to increase its growth through 2022 and beyond on the back of favourable industry tailwinds, increasing demand for solar solutions, and the company’s investment to significantly expand its solar and storage.
The company anticipates achieving adjusted EBITDA growth of over 40% in 2022 due to robust industry tailwinds, sustained federal policy backing, and accelerated demand for residential and commercial storage solutions.
Key Risk
The company has a high debt level with a net debt position of ~$285 million. However, it has attained a net debt target ahead of plan.
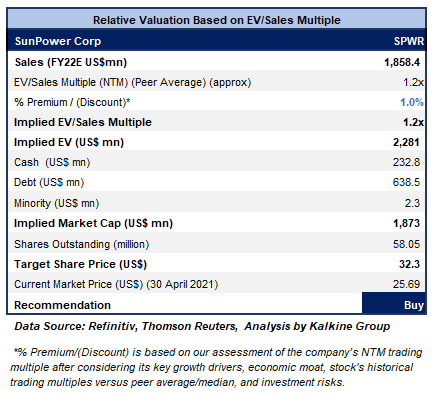
Valuation Methodology: EV/Sales Based Relative Valuation (Illustrative)
Technical Overview:
Weekly Chart –
.png)
Source: Refinitiv (Thomson Reuters)
Note: Purple colour lines are Bollinger Bands® with the upper band suggesting overbought status while the lower band oversold status, and yellow lines are Fibonacci retracement lines which measure price rebound and backtrack. https://www.bollingerbands.com/
The stock has been on correction path wherein it has corrected close to the 61.8% retracement level of $24.45 but has failed breach through the same in the past several weeks. On the first trading session of the ongoing week, it has given a softer close at $25.69. The technical indicator RSI with a reading around 47 and a curve at the end pointing down, suggests softening of momentum.
Going forward, the stock may have resistance around 20 periods SMA of $34.30 whereas support could be around the 61.8% retracement level of $24.45 as it has been holding strongly.
Stock Recommendation
The stock rose by ~60.66% in 6 months and ~320.54% in 9 months. It has made a 52-week low and high of $3.9939 and $57.5199, respectively and is trading towards the 52-week lower levels. Therefore, it can be said that the current juncture is offering decent opportunity for accumulation.
We have applied EV/Sales based relative valuation (on an illustrative basis) and the target price reflects a rise of low double-digit (in % terms). We have applied a slight premium to EV/Sales Multiple (NTM) (Peer Average) considering better net margin and strong outlook.
Considering the accelerating customer base, strong execution, robust pipeline and continued to strive towards increasing market access and profitability, as well as improving balance sheet, we give a “Buy” recommendation on the stock at the current market price of $25.69 per share, down by 5.34% on 30th April 2021.

Ormat Technologies Inc.
ORA Details
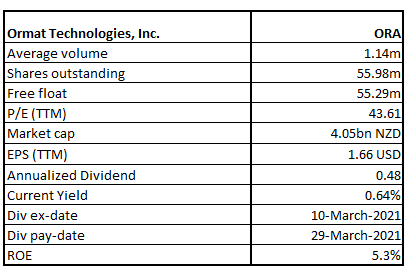
Ormat Technologies, Inc. (NYSE: ORA) is engaged in the business of providing renewable power and energy solutions to the customers globally. It designs, builds and supply power generating equipment. It also provides energy management and storage solutions.
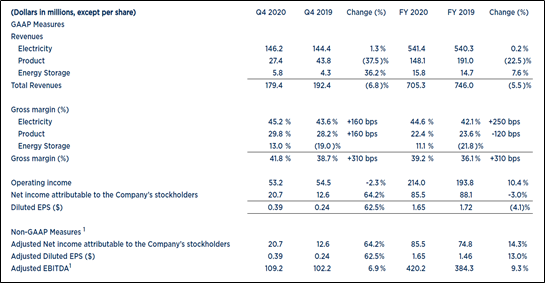
FY20 Results Performance
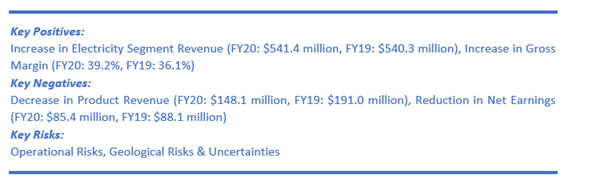
The company recorded a 5.5% YoY decline in overall revenue to $705.3 million due to lower revenue from the product segment, which overshadowed the increase in revenue from both the electricity segment and energy storage segment. Further, the net income of the company was reduced by 3% YoY to $85.5 million due to the inclusion of the effect of non-recurring tax benefit in the previous year.
Meanwhile, the company increased the quarterly dividend by 9% to $0.12 per share.
Financial Snapshot (Source: Company Reports)
Start of Commercial Production Vallecito Battery Energy Storage Facility
The company on 1 April 2021 declared beginning of commercial operation of the 10 MW/40 MWh Vallecito Battery Energy Storage System (Vallecito BESS), which cater to the requirements of Southern California Edison (SCE) by providing local resource adequacy. This is being done as per a 20-year energy storage resource adequacy agreement.
Outlook
The company has a solid growth plan to increase its combined geothermal, energy storage and solar generation to ~1.5 GW by 2023. The company has also strengthened the balance sheet through a combination of debt and equity offerings.
ORA is expecting to achieve revenue in the range of $640 million and $675 million for FY21. Besides, the company anticipates achieving adjusted EBITDA in the range of $400 million and $410 million in FY21. With the commencement of operation as well as generation at Puna Geothermal Power Plant in Q4FY20, the company expects to attain full operation by mid-2021.
Key Risks
The company’s global operations are exposed to risks like foreign laws and regulations along with geopolitical risk, and acts of terrorism. Besides, a sustained drop in product backlog would have an adverse bearing on its target of full utilization of the production and manufacturing facilities.
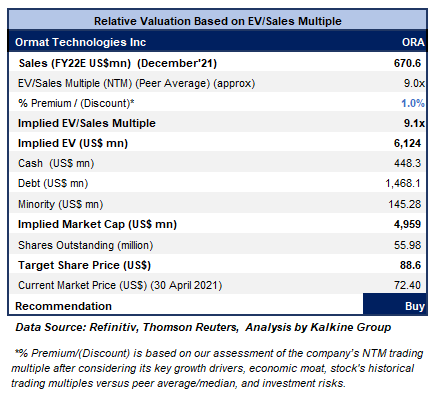
Valuation Methodology: EV/Sales Based Relative Valuation (Illustrative)
Technical Overview:
Weekly Chart –
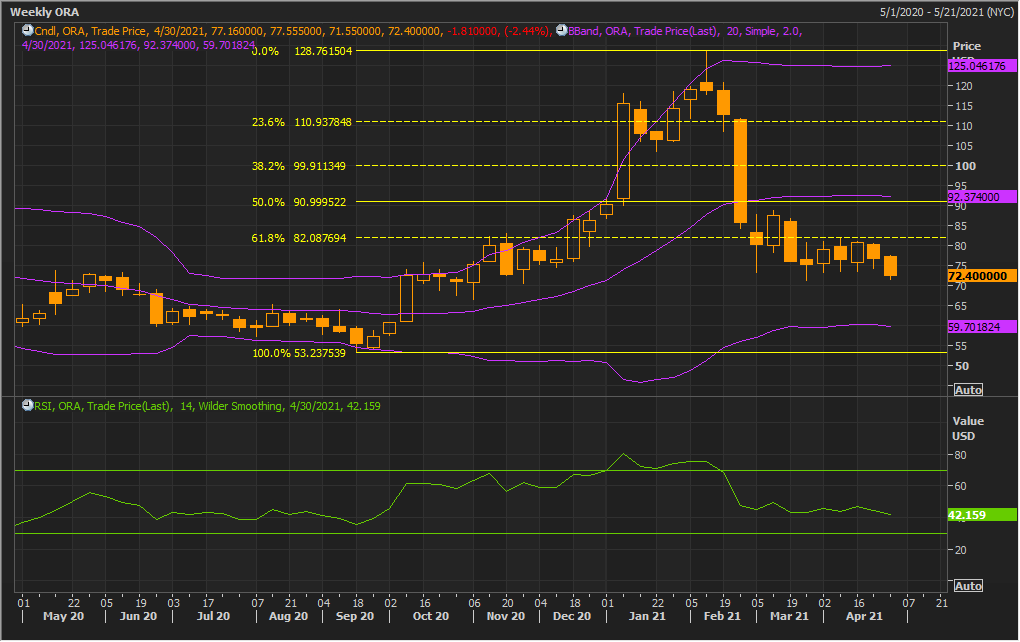
Source: Refinitiv (Thomson Reuters)
Note: Purple colour lines are Bollinger Bands® with the upper band suggesting overbought status while the lower band oversold status, and yellow lines are Fibonacci retracement lines which measure price rebound and backtrack. https://www.bollingerbands.com/
The stock has been consolidating in the range provided by $82.08 on the upside and $70 on the downside. On the first trading session of the ongoing week, the stock has given close near lower range at $72.40. The technical indicator RSI with a reading around 42 suggests neutral momentum for the stock.
Going forward, the stock may have resistance around $82.08 whereas support could be around $70. However, on breach below, it might probe $65 as the next support level.
Stock Recommendation
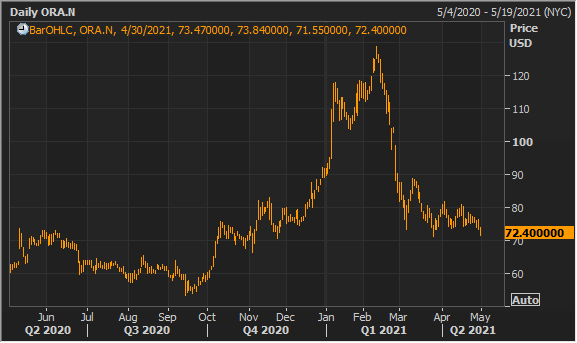
The stock declined by ~36.5% in 3 months and by ~7.80% in 1 month. It has made a 52-week low and high of $53.51 and $128.63, respectively and is trading towards the 52-week lower levels. Therefore, it can be said that the current juncture is offering decent opportunity for accumulation.
We have valued the stock using an EV/Sales multiple-based illustrative relative valuation and have arrived at a target price that reflects a rise of low double-digit (in % terms). We have assigned a slight premium to EV/Sales Multiple (NTM) (Peer Average) considering its robust growth plan which aims at tremendously boosting its solar along with geothermal capacity as well as fast-tracking its storage capacity to become a leading player in the US storage space. It plans to achieve a portfolio target of 1,455 MW – 1,575 MW by YE-2023. For the purposes of relative valuation, we have taken peers like AES Corp (AES.N), Atlantic Power Corp (AT.N), 'Clearway Energy Inc (CWENa.N), to name a few.
Considering the aforementioned factors along with its solid liquidity and capital position and decent outlook, we give a “Buy” recommendation on the stock at the current market price of $72.40 per share, down by 2.44% on 30th April 2021.
Note: Investment decisions should be made depending on the investors’ appetite on upside potential, risks, holding duration, and any previous holdings. Investors can consider exiting from the stock if the Target Price mentioned as per the Valuation has been achieved and subject to the factors discussed above.
Disclaimer - This report has been issued by Kalkine Pty Limited (ABN 34 154 808 312) (Australian financial services licence number 425376) (“Kalkine”) and prepared by Kalkine and its related bodies corporate authorised to provide general financial product advice. Kalkine.com.au and associated pages are published by Kalkine.
Any advice provided in this report is general advice only and does not take into account your objectives, financial situation or needs. You should therefore consider whether the advice is appropriate to your objectives, financial situation and needs before acting upon it.
There may be a Product Disclosure Statement, Information Statement or other offer document for the securities or other financial products referred to in Kalkine reports. You should obtain a copy of the relevant Product Disclosure Statement, Information Statement or offer document and consider the statement or document before making any decision about whether to acquire the security or product.
You should also seek advice from a financial adviser, stockbroker or other professional (including taxation and legal advice) as necessary before acting on any advice in this report or on the Kalkine website. Not all investments are appropriate for all people.
The information in this report and on the Kalkine website has been prepared from a wide variety of sources, which Kalkine, to the best of its knowledge and belief, considers accurate. Kalkine has made every effort to ensure the reliability of information contained in its reports, newsletters and websites. All information represents our views at the date of publication and may change without notice.
Kalkine does not guarantee the performance of, or returns on, any investment. To the extent permitted by law, Kalkine excludes all liability for any loss or damage arising from the use of this report, the Kalkine website and any information published on the Kalkine website (including any indirect or consequential loss, any data loss or data corruption). If the law prohibits this exclusion, Kalkine hereby limits its liability, to the extent permitted by law, to the resupply of services.
Please also read our Terms & Conditions and Financial Services Guide for further information.
On the date of publishing this report (referred to on the Kalkine website), employees and/or associates of Kalkine do not hold interests in any of the securities or other financial products covered on the Kalkine website.
 AU
AU

 Please wait processing your request...