Netwealth Group Limited
.png)
NWL Details
FUA for September Quarter Soared up 31.3% Year Over Year: Netwealth Group Limited (ASX: NWL)is one of the quickest expanding wealth management businesses in Australia. It is engaged in offering financial investors and intermediaries with services like managed funds, investor directed portfolio services, a superannuation master fund, and self-managed superannuation administration services.
Business Update for September Quarter 2019: The company stated that its funds under administration (FUA) came in at $25.3 billion as at 30 September 2019, up 31.3% year over year. The company reported FUA net inflows of $1.5 billion, which soared 39.6% from the year-ago quarter. Funds under management at the end of the quarter came in at $4.4 billion, up 12.6%. Managed accounts at the end of the quarter came in at $3.1 billion, up 12.5%. Managed funds stood at $1.3 billion as at 30 September 2019, up 12.7%.
.png)
Key Metrics for September Quarter 2019 (Source: Company Reports)
Outlook: The Company anticipates net inflow of FUA in FY2020 to be more than $7 billion, while it expects FUA to exceed $30 billion as on June 2020. Further, the company expects EBITDA margin as a percentage of revenue to be slightly below FY19. Netwealth Group Limited has a robust pipeline and is looking forward for new prospects. The company also anticipates expanding its investment in technology and people to sustain its market leading technology and service plan.
Valuation Methodology: EV/Sales Multiple Approach

EV/Sales Based Valuation (Source: Thomson Reuters)
Note: All forecasted figures and peers have been taken from Thomson Reuters, NTM-Next Twelve Months
Stock Recommendation: As per ASX, the stock gained 3.01% in the past 6 months. Currently, the stock is trading close to the average of its 52-week high and low level of $10.110 and $6.350, respectively. As on 03 January 2020, the company’s market capitalisation stands at ~$1.87 billion, with 237.69 million outstanding shares. Its EBITDA margin and net margin for FY19 stood at 51.4% and 36.5%, lower than the industry median of 58.9% and 19.7%, respectively. Its current ratio for FY19 stood at 4.36x, better than the industry median of 1.45x, which implies the company’s good liquidity position.Considering the backdrop of the above factors, we have valued the stock using EV/Sales based relative valuation method and for the purpose, have taken the peer group - Pendal Group Ltd (ASX: PDL), Magellan Financial Group Ltd (ASX: MFG), Hub24 Ltd (ASX: HUB), Pinnacle Investment Management Group Ltd (ASX: PNI). Therefore, we have arrived at the target price with a downside of lower single-digit in % terms. Hence, we have a “watch” view on the stock at the current market price of $8.070, up 2.541% on 03 January 2020.
.jpg)
NWL Daily Technical Chart (Source: Thomson Reuters)
Navigator Global Investments Limited
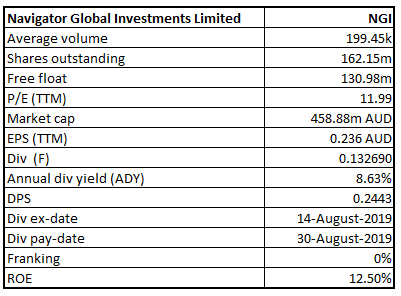
NGI Details
NGI Records FY19 NPAT of US$26.84 million: Navigator Global Investments Limited (ASX: NGI) is involved in the provision of asset management products and services to worldwide investors through Lighthouse Investment Partners, LLC (Lighthouse).
Key Takeaways for FY19 Period Ended 20 June 2019: The company reported NPAT for the period of US$26.84 million as compared to a net loss of US$13.06 million in pcp. Diluted EPS for FY19 stood at 16.55 US cents per share as compared to a loss of 8.05 US cents per share in FY18. As at 30 June 2019, the group had AUM of US$14.19 billion, out of which Commingled Funds were US$4.8 billion and Single Investor Customised Solutions were US$9.39 billion. The company’s management fee revenue increased 40% year over year and came in at US$105.4 million in FY19. In FY19, the company reported revenue of US$114.86 million, up 28% year over year. In FY19, the company reported EBITDA of US$37.7 million, up 10% year over year. Total dividend for FY19 amounted to 17 US cents per share in FY19.
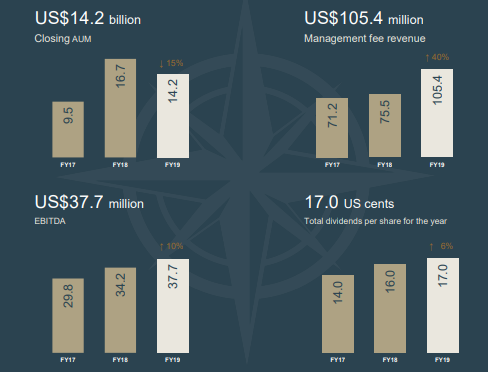
Financial Highlights (Source: Company Reports)
Cash flow Detail: In FY19, the company reported net cash flow from operations of US$22.6 million. The company exited FY19 with a cash balance of US$29 million.
What to Expect: The company remains on track to boost its managed account platform as it is considered to be a safer model for investing in hedge funds. The company is also focused on enhancing the overall efficiencies by identifying the optimum mix of talent worldwide. This will lead to improved research, data, and analysis and will help in further reducing its overall costs.
Valuation Methodology: Price to Earnings Multiple Approach
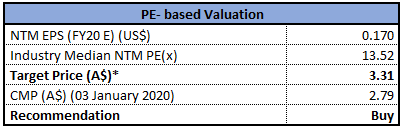
PEBased Valuation (Source: Thomson Reuters), *1 USD = 1.44 AUD
Note: All forecasted figures and peers have been taken from Thomson Reuters, NTM-Next Twelve Months
Stock Recommendation: As per ASX, the stock is trading below the average of its 52-week high and low level of $4.250 and $2.290, respectively. As on 03 January 2020, the company’s market capitalisation stands at ~$458.88 million, with 162.15 million outstanding shares. Its net margin for FY19 stood at 23.4%, higher than the industry median of 19.7%. The debt to equity ratio for FY19 was nil as compared to the industry median of 0.47x. Hence, considering the modest fundamentals, long-term business prospects, consistent dividends, and current trading levels, we have valued the stock using a relative valuation method, i.e., PE multiple and we have considered the following Peer Group for the above valuation - Pendal Group Ltd (ASX: PDL); Centuria Capital Group (ASX: CNI); Pinnacle Investment Management Group Ltd (ASX: PNI). Therefore, we have arrived at a target price of lower double-digit upside (in % term). Hence, we recommend a “Buy” rating on the stock at the current market price of $2.79, down by 1.413% on 03 January 2020.
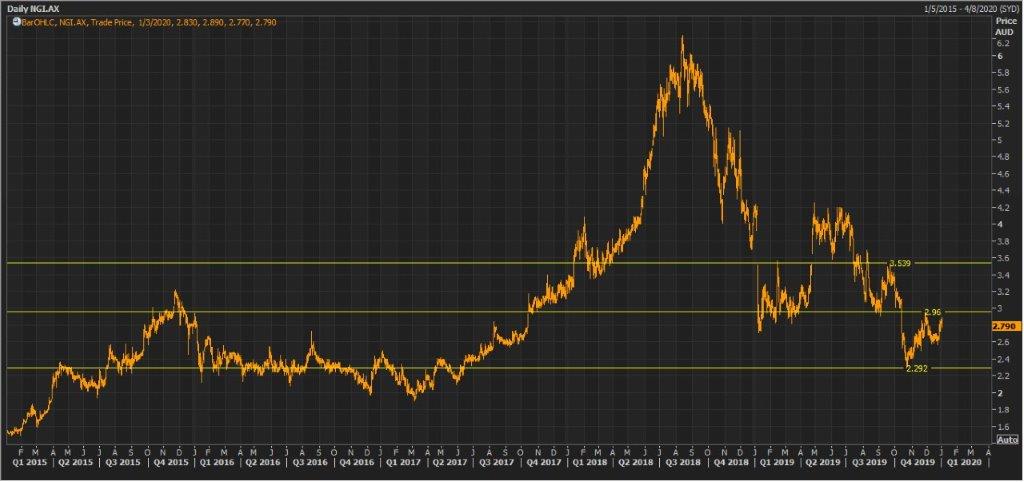
NGI Daily Technical Chart (Source: Thomson Reuters)
Disclaimer
The advice given by Kalkine Pty Ltd and provided on this website is general information only and it does not take into account your investment objectives, financial situation or needs. You should therefore consider whether the advice is appropriate to your investment objectives, financial situation and needs before acting upon it. You should seek advice from a financial adviser, stockbroker or other professional (including taxation and legal advice) as necessary before acting on any advice. Not all investments are appropriate for all people. Kalkine.com.au and associated pages are published by Kalkine Pty Ltd ABN 34 154 808 312 (Australian Financial Services License Number 425376). The information on this website has been prepared from a wide variety of sources, which Kalkine Pty Ltd, to the best of its knowledge and belief, considers accurate. You should make your own enquiries about any investments and we strongly suggest you seek advice before acting upon any recommendation. Kalkine Pty Ltd has made every effort to ensure the reliability of information contained in its newsletters and websites. All information represents our views at the date of publication and may change without notice. To the extent permitted by law, Kalkine Pty Ltd excludes all liability for any loss or damage arising from the use of this website and any information published (including any indirect or consequential loss, any data loss or data corruption). If the law prohibits this exclusion, Kalkine Pty Ltd hereby limits its liability, to the extent permitted by law to the resupply of services. There may be a product disclosure statement or other offer document for the securities and financial products we write about in Kalkine Reports. You should obtain a copy of the product disclosure statement or offer document before making any decision about whether to acquire the security or product. The link to our Terms & Conditions has been provided please go through them and also have a read of the Financial Services Guide. On the date of publishing this report (mentioned on the website), employees and/or associates of Kalkine Pty Ltd do not hold positions in any of the stocks covered on the website. These stocks can change any time and readers of the reports should not consider these stocks as advice or recommendations.
 AU
AU

 Please wait processing your request...