Celsius Holdings, Inc.
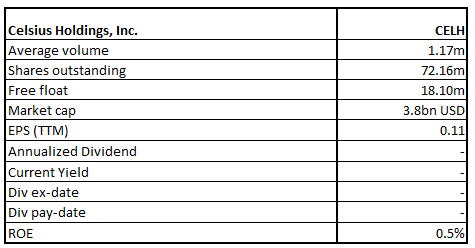
CELH Details
Celsius Holdings, Inc. (NASDAQ: CELH) operates as a global company that holds the branded, clinically proven formula for leading brand CELSIUS® which is available across delicious sparkling and non-carbonated flavours.
FY20 Result Performance (For the Year Ended December 31, 2020)
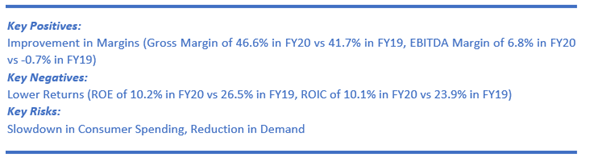
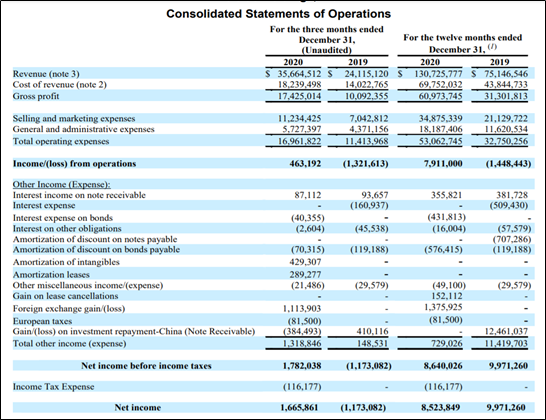
The company has recorded revenue growth of 74% YoY to $130.7 million in FY20 supported by growth across both domestic as well as international revenue. Gross profit grew strongly by 95% YoY to $60.9 million and gross margin rose to 46.6% (53.9% excluding outbound freight). Meanwhile, the company has logged a net profit of around $8.5 million in FY20 (FY19: $10.0 million) as in 2019 the profit included a net gain of $12.1 million achieved on account of the formation of a note receivable associated with the business model change in China.
Financial Snapshot (Source: Company Reports)
Q1FY21 Results Performance (For the Period Ended March 31, 2021)
The company posted healthy growth in revenue, up by 78% YoY to $50.0 million whereby domestic revenue grew by 101% YoY to $39.0 million and international revenue increased by 25% to $11.0 million. Owing to the impact of higher input costs associated with the global can shortages along with increased repack fees, gross profit margins reduced to 41.1% from 49.5% excluding outbound freight. Meanwhile, it achieved a net income of around $585,000 as against $546,000 in the year-ago quarter.
Outlook
CELH remains focused on further augmenting its reach and its US door count surpassed 92,000 locations and it plans for more expansion in 2021 owing to resets by various retailers. Additionally, it is embarking on further SKU expansion as well as innovation and the company is lined up for the launch of Strawberry Guava which is a fast protein bar portfolio in the US through Amazon in Q2 2021. Moreover, it has bagged further distribution agreements with partners in the Anheuser-Busch InBev, PepsiCo, Keurig Dr. Pepper, and MillerCoors networks.
Key Risks
The company is exposed to the risks like changes in the macro-economic environment which may adversely impact the business performance. A further slowdown in consumer spending would result in a reduction in demand for the products.
Valuation Methodology: EV/Sales Based Relative Valuation (Illustrative)
Technical Overview:
Weekly Chart –
Source: Refinitiv (Thomson Reuters)
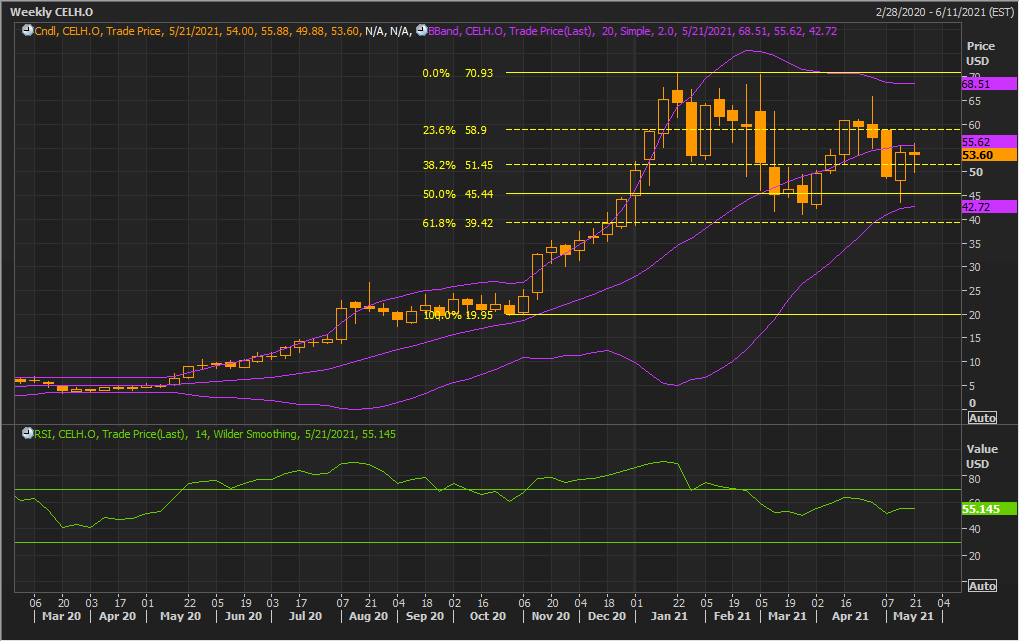
Note: Purple colour lines are Bollinger Bands® with the upper band suggesting overbought status while the lower band oversold status, and yellow lines are Fibonacci retracement lines which measure price rebound and backtrack. https://www.bollingerbands.com/
Ever since the stock made a ‘Double Top’ at $70.93 level, it has been experiencing erratic price movements. It has given a softer close for the ongoing week at $53.60, forming a ‘Hanging Man’ pattern on the chart. The technical indicator RSI with a reading around 55 suggests bullish momentum for the stock.
Going forward, the stock may have resistance around the upper Bollinger band of $68.5 whereas support could be around the 50% retracement level of $45.44.
Stock Recommendation
The stock increased by ~111.18% in 9 months and by ~67.8% in 6 months. It has made a 52-week low and high of $6.9400 and $70.6600, respectively.
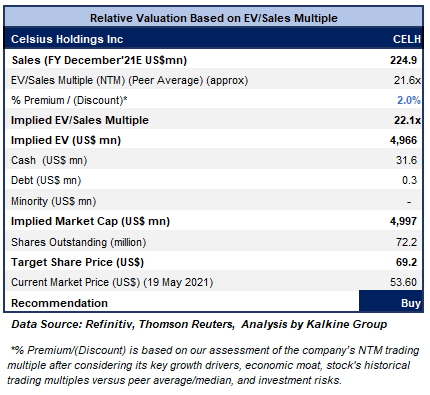
We have applied EV/Sales multiple based relative valuation (on an illustrative basis) and the target price reflects a rise of low double-digit (in % terms). We have applied a slight premium to EV/Sales Multiple (NTM) (Peer Average) considering its healthy performance in Q1FY21 along with its strong distribution reach and its balance sheet strength. For the purposes of relative valuation, we have taken peers like Freshpet Inc (FRPT.OQ), Appharvest Inc (APPH.OQ), among others. Besides, the company has a solid liquidity position with a cash balance of $31.6 million at the end of March 31, 2021. This will further provide the company with significant leeway in tapping growth opportunities going ahead.
Thus, we give a “Buy” recommendation on the stock at the current market price of $53.60 per share, up by 0.96% on 19th May 2021.
Hormel Foods Corporation
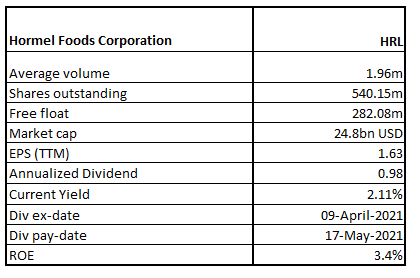
HRL Details
Hormel Foods Corporation (NYSE: HRL) is a top branded food company globally with prominent brands comprising of Skippy®, SPAM®, Hormel® Natural Choice®, Columbus®, Applegate®, Justin's®, Wholly®, Hormel® Black Label®, among others.
FY20 Result Performance (For the Year Ended October 25, 2020)
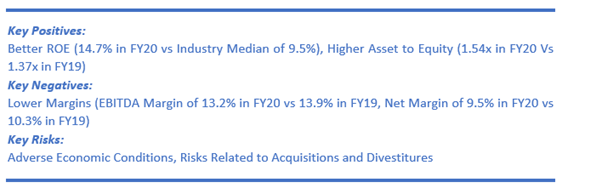
Net sales during the period rose 1% YoY to $9.6 billion backed by 2% YoY increase in organic net sales. Increase in net sales was also underpinned by higher branded retail sales across business segments as well as an increase in commodity sales in refrigerated foods and Jennie-O Turkey Store. However, lower food service sales restricted the growth. Further, the divestiture of CytoSport also weighed on the performance. Operating margin reduced to 11.5% from 12.6% mainly weighed down by higher operating costs owing to the impact of the COVID-19 pandemic.
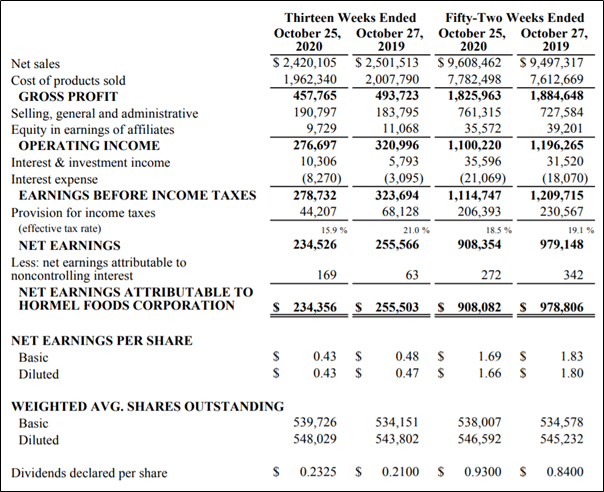
Consolidated Financial Snapshot (Figures in Thousands, Except Per Share Data) (Source: Company Reports)
Record Sales in Q1FY21
The company has reported 3% YoY growth in its net sales in Q1FY21 to $2.5 billion driven by sales growth across four segments, with excellent growth achieved by brands like SPAM®, SKIPPY®, Hormel® Black Label®, Applegate®, Columbus®, and Jennie-O®. However, the operating margin reduced to 10.9% from 11.8% in fiscal 2020 mainly impacted by lower sales and profitability from the foodservice businesses.
Outlook
HRL has guided of reporting FY21 earnings per share of $1.70 to $1.82 and expects to achieve net sales in the range of $9.70 - $10.30 billion excluding the expected impact from the acquisition of the Planters® snack nuts business. Besides, it anticipates the Planters® acquisition will aid in leveraging its balance sheet and the acquisition is likely to be backed by both cash on hand as well as short-term debt and long-term debt.
Key Risks
The company is witnessing pressure in the foodservice business as well as incremental supply chain costs which are weighing on the performance. Meanwhile, the company is anticipating a recovery in the foodservice business driven by the momentum in shipments during recent weeks.
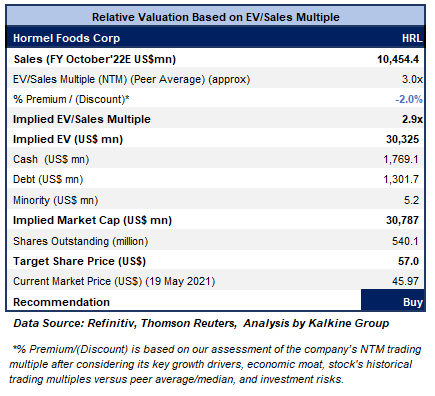
Valuation Methodology: EV/Sales Based Relative Valuation (Illustrative)
Technical Overview:
Weekly Chart –
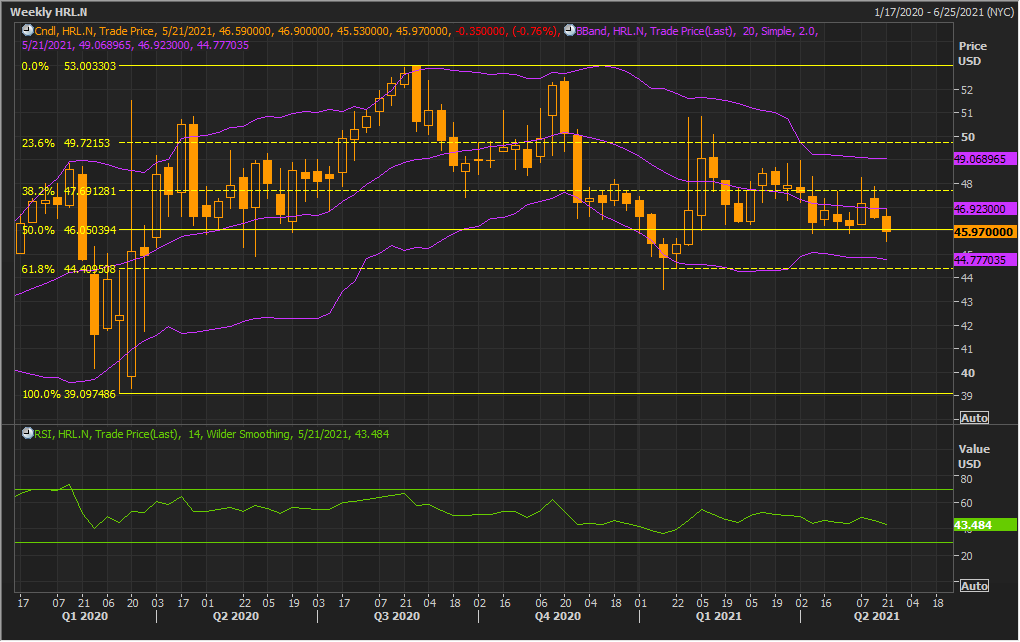
Source: Refinitiv (Thomson Reuters)
Note: Purple colour lines are Bollinger Bands® with the upper band suggesting overbought status while the lower band oversold status, and yellow lines are Fibonacci retracement lines which measure price rebound and backtrack. https://www.bollingerbands.com/
The stock has been experiencing erratic price movements. It has, however, given a weaker close at %45.97, inconsistent with the previous week’s weak closing. The technical indicator RSI with a reading around 43 suggests neutral momentum for the stock.
Going forward, the stock may have resistance around the 38.2% retracement level of $47.70 whereas support could be around the lower Bollinger band of $44.77.
Stock Recommendation
The stock declined by ~12.35% in 9 months and by ~8.11% in 6 months. It has made a 52-week low and high of $43.4900 and $52.97, respectively. The stock is trading towards the 52-week lower levels and, therefore, it can be said the current trading juncture is offering decent opportunity for accumulation.
We have applied EV/Sales multiple based relative valuation (on an illustrative basis) and the target price so arrived reflects the potential rise of low double-digit (in % terms). We have applied a slight discount to EV/Sales Multiple (NTM) (Peer Average) considering the weak performance across the foodservice businesses and higher supply chain costs as the company incurred around $15 million in direct incremental supply chain costs in Q1FY21. However, with the improvement in labour availability and commencement of decrease in the pandemic-related expenses, the company is anticipating sustained revival across the supply chain. For the purposes of relative valuation, we have taken peers like Hershey Co (HSY.N), General Mills Inc (GIS.N), Alico Inc (ALCO.OQ), among others.
Considering the aforementioned factors, we give a “Buy” recommendation on the stock at the current market price of $45.97 per share, down by 0.76% on 19th May 2021.
Note: Investment decisions should be made depending on the investors’ appetite on upside potential, risks, holding duration, and any previous holdings. Investors can consider exiting from the stock if the Target Price mentioned as per the Valuation has been achieved and subject to the factors discussed above.
Disclaimer - This report has been issued by Kalkine Pty Limited (ABN 34 154 808 312) (Australian financial services licence number 425376) (“Kalkine”) and prepared by Kalkine and its related bodies corporate authorised to provide general financial product advice. Kalkine.com.au and associated pages are published by Kalkine.
Any advice provided in this report is general advice only and does not take into account your objectives, financial situation or needs. You should therefore consider whether the advice is appropriate to your objectives, financial situation and needs before acting upon it.
There may be a Product Disclosure Statement, Information Statement or other offer document for the securities or other financial products referred to in Kalkine reports. You should obtain a copy of the relevant Product Disclosure Statement, Information Statement or offer document and consider the statement or document before making any decision about whether to acquire the security or product.
You should also seek advice from a financial adviser, stockbroker or other professional (including taxation and legal advice) as necessary before acting on any advice in this report or on the Kalkine website. Not all investments are appropriate for all people.
The information in this report and on the Kalkine website has been prepared from a wide variety of sources, which Kalkine, to the best of its knowledge and belief, considers accurate. Kalkine has made every effort to ensure the reliability of information contained in its reports, newsletters and websites. All information represents our views at the date of publication and may change without notice.
Kalkine does not guarantee the performance of, or returns on, any investment. To the extent permitted by law, Kalkine excludes all liability for any loss or damage arising from the use of this report, the Kalkine website and any information published on the Kalkine website (including any indirect or consequential loss, any data loss or data corruption). If the law prohibits this exclusion, Kalkine hereby limits its liability, to the extent permitted by law, to the resupply of services.
Please also read our Terms & Conditions and Financial Services Guide for further information.
On the date of publishing this report (referred to on the Kalkine website), employees and/or associates of Kalkine do not hold interests in any of the securities or other financial products covered on the Kalkine website.
 AU
AU

 Please wait processing your request...