Energizer Holdings, Inc
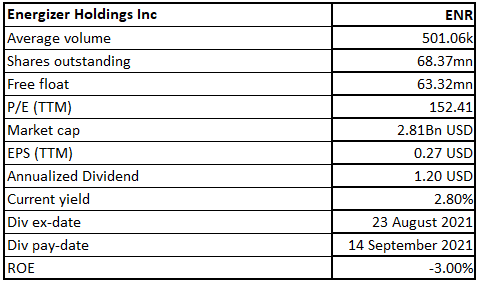
ENR Details
Energizer Holdings, Inc (NASDAQ: ENR) is one of the leading manufacturers of primary batteries and portable lighting products globally. Its key global brands include Energizer®, EVEREADY®, Rayovac®, and VARTA®.
Q2FY21 Result Performance (For the Second Quarter Ended 31 March 2021)
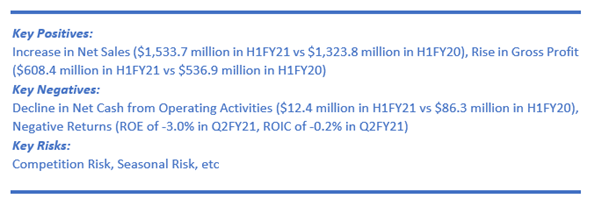
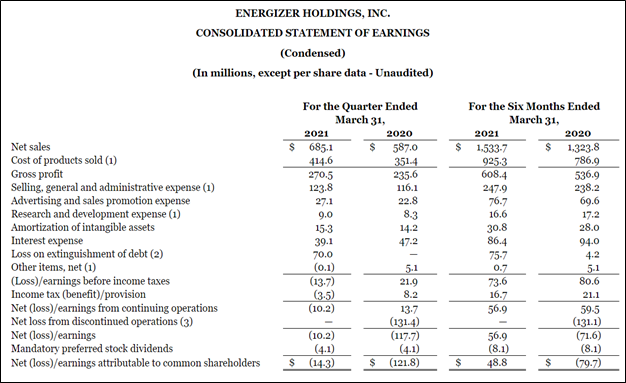
Increase in Net Sales by 16.7%: Robust demand across batteries and auto in both geographical segments has resulted in a net sales growth of 16.7% to $685.1 million.
A Decline in Adjusted Gross Margin: It witnessed a 110 basis points decline in adjusted gross margin from the prior year of 41.6% to 40.5% mainly weighed down by the channel, customer, and product mix along with the impact of operating costs. The benefits of synergies of around $14 million and favourable currency exchange rates have restricted the decline.
Registered a Diluted Net Loss from Continuing Operations Per Common Share of $0.21: It has reported a diluted net loss from continuing operations per common share of $0.21 due to a loss related to debt refinancing of $0.78 per share.
Financial Snapshot (Source: Company Reports)
Dividend Declaration
The company, on 2 August 2021, declared a quarterly dividend of $0.30 per share of common stock. It also declared a quarterly dividend of $1.875 per share of 7.50% Series A mandatory convertible preferred stock.
Succession of CFO
Timothy W. Gorman, the Executive Vice President and CFO of the company has opted to retire from his position. He will be replaced by John Drabik, Senior Vice President, Corporate Controller, and Chief Accounting Officer effective October 1, 2021. Timothy W. Gorman, however, will remain in an advisory capacity in the company through December 31, 2021.
Completion of Offering of €650 Million Senior Notes
Completion of the Offer: The company, on 23 June 2021, has declared the completion of the offering of the €650 million of 3.500% senior notes due 2029 by its indirect wholly-owned subsidiary, Energizer Gamma Acquisition B.V.
Use of Proceeds: Energizer Gamma Acquisition B.V will utilise the net proceeds from the offer along with cash on hand towards redeeming the full outstanding senior notes worth €650 million aggregate principal amount due 2026 and to pay the fees and expenses with respect to the redemption of the 2026 Notes and the offering of the Notes.
Outlook
ENR recorded organic net sales growth of 12.7% or $74.7 million in Q2FY21. Driven by sustained strong organic growth in Q2FY21, ENR is expecting to achieve net sales growth in the range of 5% to 7% for FY21 owing to distribution gains, higher battery demand, and favourable currency impacts. It also expects to attain adjusted earnings per share of between $3.30 to $3.50.
Further, it estimates its adjusted free cash flow to stay at the lower end of its earlier guided range of $325 to $350 million due to working capital requirements, with respect to inventory to cater to increased demand.
Meanwhile, the company announced that it will release results for Q3FY21 on August 9, 2021.
Key Risks
The company is exposed to the risk of currency fluctuations, which may adversely affect its financial performance. Volatility in production costs primarily the raw material prices, could erode its profit margins. Further, the risk of changes in the retail environment and consumer preferences also remain a major concern. Moreover, it faces the risk of supply chain disruption due to its reliance on certain significant suppliers.
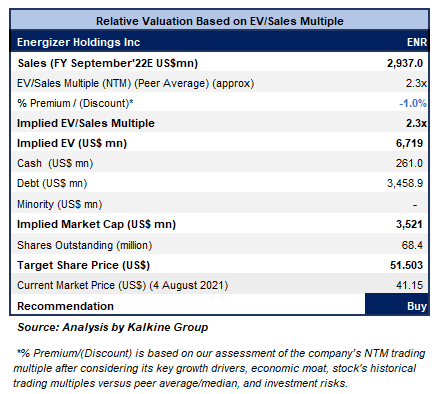
Valuation Methodology: EV/Sales Based Relative Valuation (Illustrative)
Technical Overview:
Chart:
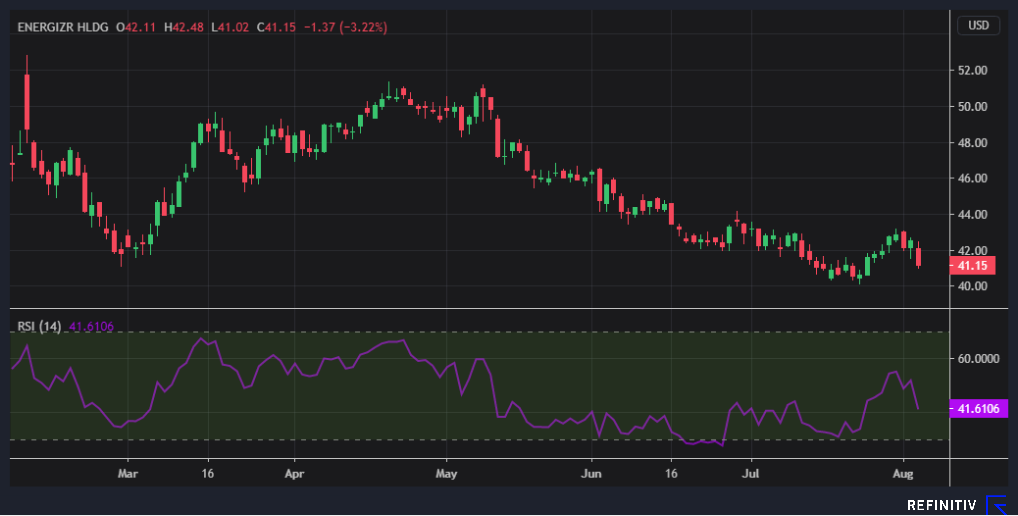
Source: REFINITIV
Note: Purple Color Line Reflects RSI (14-Period)
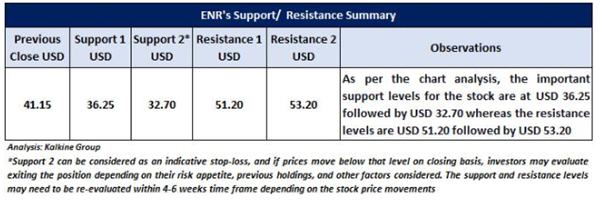
Stock Recommendation
ENR’s stock declined by ~15.4% in 3 months. It has made a 52-week low and high of $38.59 and $53.19, respectively.
We have valued the stock using an EV/Sales multiple-based illustrative relative valuation and have arrived at a target price that reflects a rise of low double-digit (in % terms). We have assigned a slight discount to EV/Sales Multiple (NTM) (Peer Average) considering cost side inflation and expectation of lower adjusted free cash flow generation due to higher capex.
Meanwhile, recently, the company has announced its intention of the broad-based increase in prices across its global battery business to equipoise the impact of cost side pressure. These price increases will be phased in throughout fiscal 2022 and it aims to generate the entire benefit of these changes in the back half of fiscal 2022.
For the purposes of relative valuation, we have taken peers like Newell Brands Inc (NWL.OQ), Church & Dwight Co Inc (CHD.N), to name a few.
Considering the aforementioned factors, elevated battery demand, steady strong organic growth, and decent outlook, we give a “Buy” recommendation on the stock at the current market price of $41.15 per share, down by 3.22% on 4th August 2021.
Bloom Energy Corporation
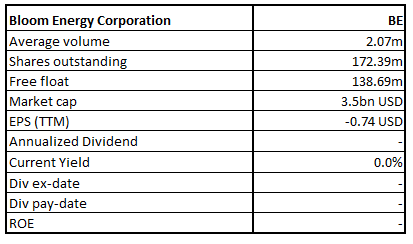
BE Details
Bloom Energy Corporation (NYSE: BE) deals in the business of providing clean, reliable, and affordable energy and for this, it has developed an energy server platform. It’s Bloom Energy Server provides extremely reliable and resilient power to its customers across industries. Its market capitalization as on August 4, 2021, stood at ~US$3.5 billion.
GAPP Results Performance (For the Period Ended 31 March 2021 – Q1FY21)
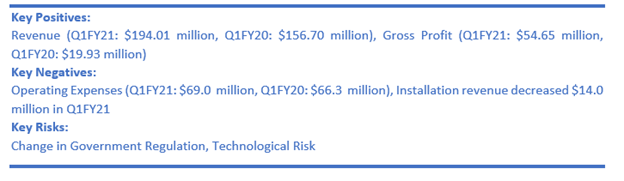
Significant Rise in Revenue: The company has reported a 23.8% YoY rise in revenue to $194.0 million as against $156.7 million in Q1FY20 mainly driven by product revenue which grew significantly by 38.5% YoY supported by a 40.2% rise in product acceptances to 359, or 35.9 MW.
Increase in Gross Margin: The company witnessed a significant improvement in its gross margin to 28.2% in Q1FY21 from 12.7% in Q1FY20, mainly assisted by an uptick in product gross margin to 36.7% from 27.2%.
Decrease in Net Loss: A significant improvement in margins and reduction in interest expenses led to a sharp decline in a net loss to $24.9 million in Q1FY21 against a net loss of $75.9 million in Q1FY20.
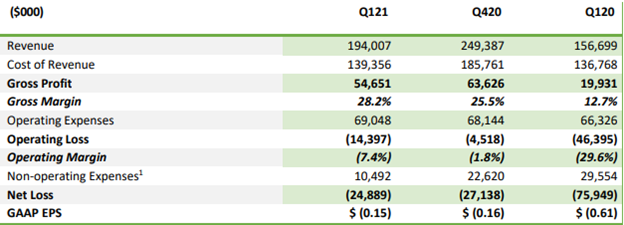
Key Data (Source: Company Reports)
Recent Update:
The company released its Q2 FY 2021 results. Its revenue was $228.5 Mn in the Q2 FY 2021, reflecting an increase of 21.6% as compared to the revenue of $187.9 Mn in the Q2 FY 2020. Notably, its product revenue amounted to $146.9 Mn in the second quarter of 2021, implying an increase of 26.4% from the Q2 of 2020, mainly driven by the 41.5% rise in acceptances.
Outlook:
BE reaffirmed its outlook for FY 2021. Its revenue is expected to be in the range of $950 Mn - $1 Bn and its non-GAAP gross margin is anticipated to be ~25%. Its non-GAAP operating margin is expected to be ~3%. Notably, non-GAAP gross margin as well as non-GAAP operating margin only exclude the stock-based compensation expense.
Key Risks
The company’s operations are exposed to global economic conditions and uncertainties in the geopolitical environment it operates in. Further, tremendous upfront costs incurred for its energy servers, manufacturing defects risk, lengthy sales, and installation cycle of its products are some other potential risks.
Valuation Methodology: EV/Sales Based Relative Valuation (Illustrative)
Technical Overview:
Chart:
.png)
Source: REFINITIV
Note: Purple Color Line Reflects RSI (14-Period)
Stock Recommendation
The company’s gross margin for Q1FY21 stood at 28.2%, better than the Q1FY20 result of 12.7%. Its asset turnover for Q1FY21 stood at 0.13x, better than the Q1FY20 result of 0.12x.
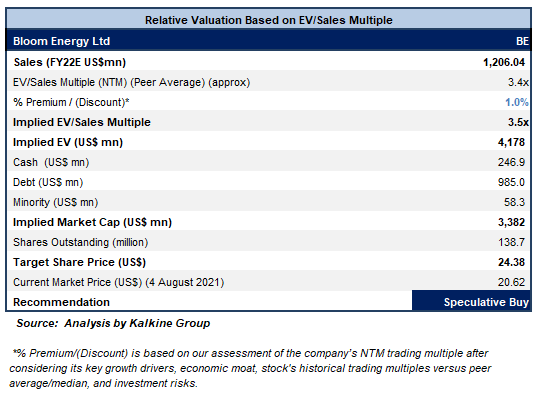
We have valued the stock using an EV/Sales multiple-based illustrative relative valuation and have arrived at a target price that reflects a rise of low double-digit (in % terms). We have assigned a slight premium to EV/Sales Multiple (NTM) (Peer Average) considering decent outlook as well as rise in revenue in Q1 FY 2021 on the YoY basis.
Considering the aforesaid facts, we give a “Speculative Buy” recommendation on the stock at the current market price of $20.62 per share, down by 3.78% on August 4, 2021.
Note 1: The reference data in this report has been partly sourced from REFINITIV.
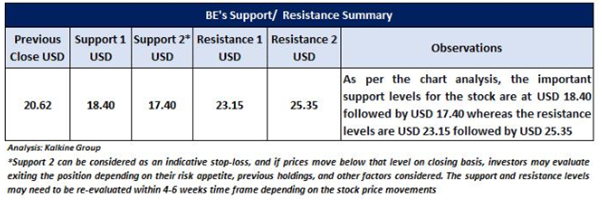
Note 2: Investment decisions should be made depending on the investors’ appetite on upside potential, risks, holding duration, and any previous holdings. Investors can consider exiting from the stock if the Target Price mentioned as per the analysis has been achieved and subject to the factors discussed above alongside support levels provided.
Technical Indicators Defined:-
Support: A level where-in the stock prices tend to find support if they are falling, and downtrend may take a pause backed by demand or buying interest.
Resistance: A level where-in the stock prices tend to find resistance when they are rising, and uptrend may take a pause due to profit booking or selling interest.
Stop-loss: It is a level to protect further losses in case of unfavourable movement in the stock prices.
Disclaimer - This report has been issued by Kalkine Pty Limited (ABN 34 154 808 312) (Australian financial services licence number 425376) (“Kalkine”) and prepared by Kalkine and its related bodies corporate authorised to provide general financial product advice. Kalkine.com.au and associated pages are published by Kalkine.
Any advice provided in this report is general advice only and does not take into account your objectives, financial situation or needs. You should therefore consider whether the advice is appropriate to your objectives, financial situation and needs before acting upon it.
There may be a Product Disclosure Statement, Information Statement or other offer document for the securities or other financial products referred to in Kalkine reports. You should obtain a copy of the relevant Product Disclosure Statement, Information Statement or offer document and consider the statement or document before making any decision about whether to acquire the security or product.
You should also seek advice from a financial adviser, stockbroker or other professional (including taxation and legal advice) as necessary before acting on any advice in this report or on the Kalkine website. Not all investments are appropriate for all people.
The information in this report and on the Kalkine website has been prepared from a wide variety of sources, which Kalkine, to the best of its knowledge and belief, considers accurate. Kalkine has made every effort to ensure the reliability of information contained in its reports, newsletters and websites. All information represents our views at the date of publication and may change without notice.
Kalkine does not guarantee the performance of, or returns on, any investment. To the extent permitted by law, Kalkine excludes all liability for any loss or damage arising from the use of this report, the Kalkine website and any information published on the Kalkine website (including any indirect or consequential loss, any data loss or data corruption). If the law prohibits this exclusion, Kalkine hereby limits its liability, to the extent permitted by law, to the resupply of services.
Please also read our Terms & Conditions and Financial Services Guide for further information.
On the date of publishing this report (referred to on the Kalkine website), employees and/or associates of Kalkine do not hold interests in any of the securities or other financial products covered on the Kalkine website.
 AU
AU

 Please wait processing your request...