
Company Overview: Westgold Resources Limited is engaged in exploration of minerals. The principal activity of the Company is operating gold mines in Australia. The Company’s projects include Central Murchison Gold Project (CMGP), South Kalgoorlie Operations (SKO), Fortnum Gold Project (FGP), Tuckabianna Project and Rover Project. The CMGP is located in the Murchison Goldfields of Western Australia around the regional towns of Cue and Meekatharra. SKO includes the HBJ underground mine, a number of open pits and the Jubilee Mill. The FGP is located in the western Bryah Basin approximately 150 kilometers northwest of Meekatharra with approximately 1 million tone-per-annum carbon-in-leach (CIL). The Rover Project is a postulated undercover repetition of the prolific Tennant Creek goldfield located 80 kilometers to the north-east..png)
WGX Details
Top-Line CAGR at 21.03% over FY14-19: Westgold Resources Limited (ASX: WGX) is involved in the exploration, development and operation of gold mines, primarily in Western Australia. The core business of the group is its three Murchison region assets at Fortnum Gold Operations (FGO), Meekatharra Gold Operations (MGO) and Cue Gold Operations (CGO), where it dominates the region with processing plants in the north (FGO), central (MGO) and south (CGO). The company has also invested in its neighbour at CGO, Musgrave Minerals Limited, where it holds a 16.5% stake. Musgrave continues to successfully explore the Lena, Break of Day and other regional prospects in the area.
Looking at the past performance over FY14 to FY19, top-line of the company has grown with a CAGR (compounded annual growth rate) of 21.03%. Group’s total revenue improved from $161.1 Mn in FY14 to $418.3 Mn in FY19. Group’s total revenue improved from $276.8 Mn in FY18 to $418.3 Mn in FY19 and posted profit after tax of $14.1 Mn in FY19 as compared to the loss of $1.2 Mn in the previous year. The FY19 results reflected the continued expansion of the Group’s activities in the Murchison Region and the rationalisation of group assets to focus on the core Murchison assets. Backed by the turnaround seen in bottom-line in FY19 and strengthened the balance sheet, the Group is determined to achieve decent progress and large capital re-investment in its core operations without the stress of debt funding with minimum shareholder dilution.
Moreover, the company’s heavy investments in the Murchison region are coming to fruition as the group now holds a massive control position in the region of the large gold resource base. All of its plants are now operating at full capacity leading to a rise in output..png)
WGX Corporate Structure (Source: Company Reports)
Key Highlights of September’19 Quarter: Group’s gold output for the quarter stood at 57,472 ounces at a Cash cost (C1) of A$1,173/oz and an All-In Sustaining Costs of A$1,410/oz. The gold output was outside physical guidance of 9% but has beaten fiscal (range midpoint) by 7% for cash costs (C1) and 2% for AISC. Group’s gold operations also benefitted from a stronger achieved gold price of A$1,959/oz after delivering into hedges and pre-pay.
Fortnum Gold Operations (FGO) saw gold output below guidance by 14% to 13,764 ounces impacted by lower mine grades from bulk stoping and stockpiles. Meekatharra Gold Operations (MGO) output was in-line with guidance at 25,958 ounces as the increased output from the newly commissioned secondary crushing circuit increased production and the remedial actions taken to improve dilution in the bulk ultramafic hosted lodes at Fatt’s and Mudlode. Cue Gold Operations (CGO) output was below guidance by 15% to 17,750 ounces, due to delay in tonnes won from ore development at the Big Bell Underground Mine as rehabilitation of old drives in the cave zone consequently delayed the development of new ore drives.
The gold hedge position at the end of the quarter stood at 202,500 ounces at an average of A$1,879/oz (essentially 10,000 ounces per month until June 2021)..png)
September Quarter Physical and Financial Outputs (Source: Company Reports)
Cash & Bullion at the end of Sep. Qtr. Stood at $70.8 Mn: Mine operating cash flow for the quarter stood at $25.3 Mn. FGO generated a Mine Operating Cash Flow of $10.5 million and Net Mine Cash Flow of $8.6 million during the quarter. MGO generated a Mine Operating Cash Flow of $8.3 million for the quarter and Net Mine Cash Outflow of $0.5 million for the quarter. The company closed the quarter with cash and bullion of $70.8 Mn.
WGX has reduced its gold pre-pay debt by 3,750 ounces to 11,250 ounces with around $6.1 Mn amortising/ repaid over the quarter. Moving forward, the company expects to continue to amortise a 1,250 ounces per month until fully eliminated as on June 30, 2020..png)
Quarterly Cash and Bullion Movements (Source: Company Reports)
FY19 Key Highlights for the period ended June 30, 2019: Consolidated revenue from continuing operations increased by 51% over the prior year to $418,317,447, as compared to $276,829,283 in FY2018. This was mainly due to the third-party revenue from Australian Contract Mining Pty Ltd (ACM)’s external mining activities. Consolidated total cost of sales from continuing operations increased by 35% over the prior year to $408,078,123 as compared to $302,289,538 in FY18. Group’s profit after income tax from continuing operations increased by 142% to $13,487,139 as compared to the loss of $31,906,035 in FY18.
Group’s net assets grew by 9.3% to $443.49 million despite the sale of the Higginsville Gold Operations, and it closed the period with cash and cash equivalents of $67.2 Mn..png)
FY19 Income Statement (Source: Company Reports)
Top 10 Shareholders: The top 10 shareholders have been highlighted in the table, which together form around 47.09% of the total shareholding. Ruffer LLP and United Fiber System Ltd hold maximum interest in the company at 9.33% and 9.01%, respectively..png)
Top 10 Shareholders (Source: Thomson Reuters)
A Quick Look at Key Metrics: Its gross margin, EBITDA margin and net margin for FY19 stood at 2.4%, 25.3% and 3.3%, better than FY18 results, which implies that the company’s fundamentals have improved during the period. Its ROE for FY19 stood at 3.2%, better than FY18 result of -9.0%. Its cash cycle for FY19 stood at 29.70 days, lower than the industry median of 46.6 days, which implies that the company efficiently managed its asset-liability balances. Its debt to equity multiple and long-term debt to total capital for FY19 stood at 0.08x and 3.8%, lower than the industry median of 0.13x and 6.2%, respectively..png)
Key Metrics (Source: Thomson Reuters)
Recent Update:
On December 3, 2019, the company announced the completion of the demerger of Castile Resources Ltd., which was overwhelmingly approved (99.9% in favor) by the shareholders. The in-specie distribution of Castile shares to WGX shareholders on a one for four basis stands completed. Meanwhile, Castile lodged a prospectus with ASIC for a non-renounceable pro-rata entitlement offer. According to the prospectus, every Castile shareholder has the right but not the obligation to have an additional Castile share for each share, it was allotted in the demerger at a price of $0.20 per share. Castile aims to fulfill all requirements to list on the ASX with an anticipated date towards the end of January 2020.
On November 27, 2019, Fe Limited (ASX: FEL) announced that it has entered into a sale and purchase agreement with Aragon Resources Pty Ltd, subsidiary of Westgold Resources Limited. As per the agreement, FEL via its wholly-owned subsidiary Jackson Minerals Pty Ltd, will sell its 20% interest in tenements E52/1671 and E52/1659 located in the Bryah Basin. Under the terms, FEL will receive 200,000 fully paid ordinary shares in WGX upon completion of the transaction. The receipt of WGX shares gives a good opportunity to FEL to indirectly participate in the projects or monetise it to assist them in funding their ongoing exploration activities at its prospective Pilbara tenement package. On Westgold perspective, the acquisition clears the path to mining the high-grade gold cap above the Forrest Prospect. The mining of the gold cap will also expose the high-grade copper already defined at Forrest and Westgold could consider the mining and commercialisation of the copper with Auris, by the simple addition of float cells at its operating Fortnum Plant.
Key Risks: The company is exposed to interest rate risk, credit risk, equity price risk, liquidity risk, and commodity price risk. It usually undertakes aging analysis and monitoring of receivables to manage credit risk, liquidity risk, through the development of future rolling cash flow forecasts.
What to Expect: Guidance for FGO in FY2020 has been estimated at 65-70,000 ounces at a cash cost (C1) of A$1,150-1,200/oz and AISC of A$1,370-1,420/oz.
Guidance for MGO in FY2020 has been estimated at 110-120,000 ounces at a cash cost (C1) of A$1,350-1,400/oz and AISC of A$1,550-1,600/oz. Company has commenced works on the third underground mine at MGO during the quarter at Bluebird. The pre-production capital to bring Bluebird is estimated at around A$10 Mn, that it will build to be a steady 15-20,000 tonne per month underground mine on the doorstep of the process plant.
Guidance for CGO in FY 2020 has been estimated at 100-110,000 ounces at cash cost (C1) A$1,065–1,125/oz and AISC of A$1,215– 1,265/oz. The company believes that it is capable of mitigating the first quarter shortfall and maintains its full-year guidance..png)
FY20 Production, Cash Costs and AISC Guidance (Source: Company Reports).png)
Key Valuation Metrics (Source: Thomson Reuters)
Valuation Methodologies:
Method 1: Price to Earnings (PE) Multiple Approach (NTM):.png)
Price to Earnings Multiple Approach (Source: Thomson Reuters)
Method 2: Price to Cash Flow Multiple Approach (NTM): .png)
Price to Cash Flow Multiple Approach (Source: Thomson Reuters)
Method 3: EV/Sales Multiple Approach (NTM):.png)
EV/Sales Multiple Approach (Source: Thomson Reuters)
Note: All forecasted figures and peers have been taken from Thomson Reuters, NTM-Next Twelve Months
Stock Recommendation: The stock generated an excellent return of 126.44% in one-year period, while in the span of six months, it generated a return of 25.08%. The company has performed well on its top-line and posted a net profit after tax for FY19 as compared to a loss in the previous year. On the backdrop of decent cash position and ongoing projects, it is expected that the company will emphasize on further improving its top-line and bottom-line performance. Looking at the prospects of the company over the long-term, we have valued the stock using three relative valuation methods, i.e., Price/Earnings (PE), Price/Cash flow, and EV/Sales multiples, and arrived at a target price upside of double-digit growth (in % term). Hence, considering the aforesaid parameters and current trading levels, we recommend a “Buy” rating on the stock at the current market price of $1.920 per share, down 2.538% on December 10, 2019.
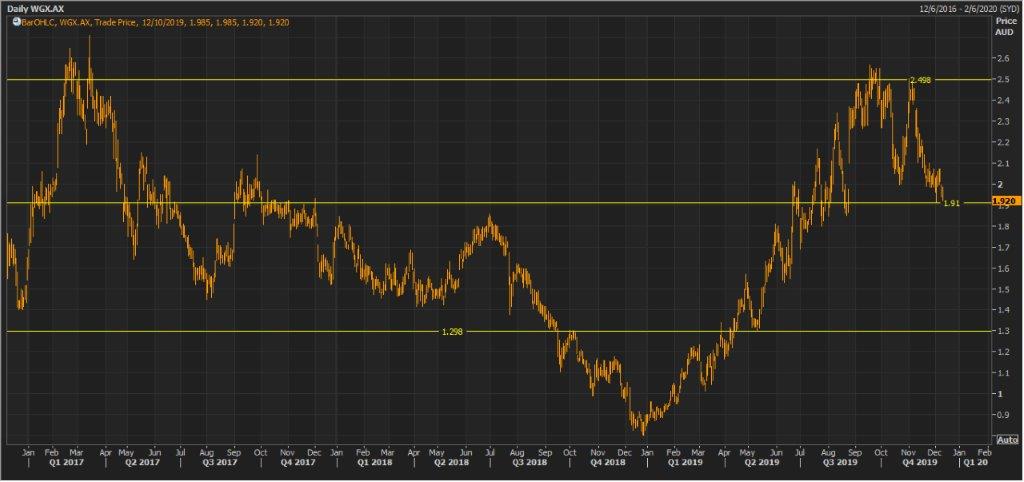
WGX Daily Technical Chart (Source: Thomson Reuters)
Disclaimer
The advice given by Kalkine Pty Ltd and provided on this website is general information only and it does not take into account your investment objectives, financial situation or needs. You should therefore consider whether the advice is appropriate to your investment objectives, financial situation and needs before acting upon it. You should seek advice from a financial adviser, stockbroker or other professional (including taxation and legal advice) as necessary before acting on any advice. Not all investments are appropriate for all people. Kalkine.com.au and associated pages are published by Kalkine Pty Ltd ABN 34 154 808 312 (Australian Financial Services License Number 425376). The information on this website has been prepared from a wide variety of sources, which Kalkine Pty Ltd, to the best of its knowledge and belief, considers accurate. You should make your own enquiries about any investments and we strongly suggest you seek advice before acting upon any recommendation. Kalkine Pty Ltd has made every effort to ensure the reliability of information contained in its newsletters and websites. All information represents our views at the date of publication and may change without notice. To the extent permitted by law, Kalkine Pty Ltd excludes all liability for any loss or damage arising from the use of this website and any information published (including any indirect or consequential loss, any data loss or data corruption). If the law prohibits this exclusion, Kalkine Pty Ltd hereby limits its liability, to the extent permitted by law to the resupply of services. There may be a product disclosure statement or other offer document for the securities and financial products we write about in Kalkine Reports. You should obtain a copy of the product disclosure statement or offer document before making any decision about whether to acquire the security or product. The link to our Terms & Conditions has been provided please go through them and also have a read of the Financial Services Guide. On the date of publishing this report (mentioned on the website), employees and/or associates of Kalkine Pty Ltd do not hold positions in any of the stocks covered on the website. These stocks can change any time and readers of the reports should not consider these stocks as personalised advice.
Past performance is not a reliable indicator of future performance.
 Please wait processing your request...