Company Overview – Westfield group is the second largest global retail REIT with interests in 100 malls with a gross value of AUD 34 billion and assets under management of AUD 70 billion. Westfield’s passive investments generate about 80% of group earnings before interests and taxes, with the balance derived from management fees and development income. It differs from peers by developing malls in signature locations, with most an objective of each asset being a destination centre, with comprehensive entertainment facilities and premium retailers.
Analysis – Westfield group is selling its three smallest U.K regional shopping centres for GBP 597 million, in line with book value. If sale conditions are satisfied settlement will occur in mid – 2014 resulting in gross proceeds of AUD 1.1 billion. We are not surprised by the sale as Westfield has systematically been selling assets in the U.S, U.K and New Zealand that it deems non-core. Effectively these non-core assets are smaller shopping centres that don’t align with Westfield’s strategy to own large, dominant shopping centres in affluent areas. Westfield call these “iconic” assets and it has achieved considerable success with this strategy in the recent years, delivering significant value for the security holders from the recently created assets of Westfield London, Westfield Stratford and Westfield Sydney.
|
WDC, AUD Millions |
2013 |
2012 |
2011 |
2010 |
2009 |
|
Total Revenue |
2,385.1 |
2,220.2 |
4,006.0 |
3,625.6 |
4,123.0 |
|
Gross Profit |
1,357.9 |
1,425.7 |
1,588.7 |
2,513.7 |
2,469.1 |
|
Total Operating Expense |
39.2 |
(280.3) |
2,127.6 |
2,234.5 |
1,768.9 |
|
Operating Income |
2,345.9 |
2,500.5 |
1,878.4 |
1,391.1 |
2,354.1 |
|
Net Income Before Taxes |
1,906.5 |
1,962.6 |
1,583.4 |
1,498.9 |
(625.1) |
|
Provision for Income Taxes |
285.2 |
203.7 |
117.2 |
374.1 |
(175.0) |
|
Net Income After Taxes |
1,621.3 |
1,758.9 |
1,466.2 |
1,124.8 |
(450.1) |
Westfield’s group well located malls capture a high share of wallet in their catchment area, providing disincentive to competition. Westfield also benefits from the network effects of its larger format malls which have generated stronger sales growth then the overall market. However as consumers spend less to reduce debt and purchase more goods online, the sales growth trajectory should slow, leading to a lower growth rate and hence downward pressure on property values. Westfield is responding by repositioning its portfolio to the premium segment. Westfield’s expansion into new geographies will further stoke its AUD 12 billion development pipeline but also brings added execution and operational risk. Despite this we expect excess returns to be sustained.
|
WDC |
Industry Median |
2013 |
2012 |
2011 |
2010 |
2009 |
|
Profitability |
|
|
|
|
|
|
|
Gross Margin |
72.9% |
56.9% |
64.2% |
39.7% |
69.3% |
59.9% |
|
EBITDA Margin |
67.0% |
49.9% |
55.6% |
35.1% |
64.1% |
59.9% |
|
Operating Margin |
66.4% |
98.4% |
112.6% |
46.9% |
38.4% |
57.1% |
|
Earning Power |
|
|
|
|
|
|
|
Pretax ROA |
5.7% |
5.5% |
5.5% |
4.3% |
3.6% |
(1.2%) |
|
Pretax ROE |
8.7% |
12.5% |
12.7% |
9.9% |
7.4% |
(2.6%) |
|
Liquidity |
|
|
|
|
|
|
|
Quick Ratio |
0.96 |
0.95 |
0.62 |
0.49 |
0.45 |
0.20 |
|
Current Ratio |
0.79 |
0.99 |
0.66 |
0.51 |
0.73 |
0.20 |
|
Leverage |
|
|
|
|
|
|
|
Assets/Equity |
1.54 |
2.31 |
2.21 |
2.39 |
2.18 |
1.96 |
|
Debt/Equity |
0.41 |
0.93 |
0.84 |
1.01 |
0.93 |
0.74 |
Westfield’s increasing focus on premium malls provides a stronger growth outlook than other malls, because of a better tenant mix, higher occupancy and sales growth and because of this better redevelopment prospects. Earnings growth for the Australian assets will trend down in the next three years as online sales leakage and consumer deleveraging impacts retailers’ ability to absorb rent increases. Despite an expectation for sales to slow, property values are likely to rise during 2014, largely because of lower borrowing costs flowing through to lower discount rates in valuations.
Westfield’s “iconic” assets are developing a status akin to a tourist destination. These assets are designed to have the maximum customer pulling power, enabling them to attract the best tenants. In many respects this strategy begets a virtuous cycle delivering superior outcomes for both tenants and the landlord. These positive network effects and the efficient scale of its assets are the key reasons we like WDC. We acknowledge the rise of online retailing and mobile devices means that the retail industry is likely still in the early stages of an unprecedented transformation. We don’t see a demise of the bricks and mortar retail, but there will be further retail categories that will fall victim to online retail.
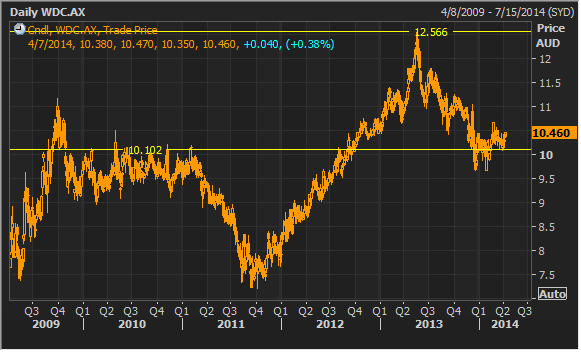 WDC Daily Chart (Source – Thomson Reuters)
Categories that have already fallen victim include bookstores and some consumer electronic categories. We expect categories that sell items that are homogeneous that are homogeneous and can be readily delivered will face mounting challenges in the coming years. This is likely to include some apparel stores, low end jewellery and home wares. But demise of these and other categories should not be a major issue for the better quality shopping malls as their high foot traffic and nearly full occupancy means there is generally a waiting list of tenants to fill the vacated space. On average we expect incoming tenants will have slightly less rent paying capacity than the outgoing tenant. We expect the rents to continue to rise despite a gradual rotation of tenants , but we expect the death of some retail categories will gradually ease demand and supply tension, leading to a moderating long tern rental growth rental growth trajectory.
WDC reported a FY13 statutory net profit of $1,603m. Following very subdued revaluations in the first half, positive revaluations predominantly in the US have driven a substantial $763m of property revaluations in 2h 2013. Management income was up strongly compared with the previous corresponding period. Management income was up 9.7% over FY12 to $140.6m primarily as a result of the US joint ventures and the growth of the underlying portfolio income. Property development and project management income was up 5.3% to $203.7m, which included contributions from developments at Mt. Gravatt, Miranda, Macquarie, West Lakes and Westfield Sydney in Australia; Garden State Plaza and Montgomery and World Trade Centre in the US and Stratford in the UK. Overhead expenses declined 7.4% to $207.7m reflecting cost savings from divestments and the impact of the efficiency program in recent years.
Consistent with other mall owners Westfield has a large part of its business focused on developing existing malls and undertaking greenfield developments. In our view Westfield is and will remain a market leader in mall development, reflecting its substantial in house expertise, strong balance sheet and the options it has to develop existing malls. This is evidenced by strong outcomes in terms of sales per square metre and capitalisation rates from its recent major developments in London, Sydney and Stratford City, UK. Westfield has scope to significantly increase its annual development commitments, which will bring forwards future development earnings and the repositioning of its portfolio to the premium retail segment. Further recovery in the US economy would be a catalyst for stronger than already improved reletting outcomes and higher US occupancy rate. Rents for the US and the U.K assets are well below the market rates. We expect strong rental growth from leasing activity in these markets during 2014 and 2015. We will be putting a BUY on the stock at the current price of $10.46.
Disclaimer
Kalkine provides general advice on securities. Kalkine does not provide advice that takes into account your, or anybody else’s investment objectives, financial situation or needs. We strongly suggest that you should make your own enquiries about any investments and we strongly suggest you seek advice before acting upon any recommendation. Kalkine Pty Ltd has made every effort to ensure the reliability of information contained in its newsletters and websites. All information represents our views at the date of publication and may change without notice. Employees and/or associates of Kalkine Pty Ltd may hold one or more of the stocks reviewed on this website. On the date of publishing this report (mentioned on the website), employees and/or associates of Kalkine Pty Ltd currently hold positions in: BHP, BKY, KCN, PDN, and RIO. These stocks can change any time and readers of the reports should not consider these stocks as advice or recommendations.
Copyright
Copyright © 2014 Kalkine Pty Ltd ABN 34 154 808 312. No part of this website, or its content, may be reproduced in any form without the prior consent of Kalkine Pty Ltd.
Kalkine is a trading name of Kalkine Pty Ltd ABN 34 154 808 312, which holds Australian Financial Services Licence No. 425376.
Past performance is not a reliable indicator of future performance.

 Please wait processing your request...