Kalkine has a fully transformed New Avatar.

Company Overview: Wells Fargo & Company is a bank holding company. The Company is a diversified financial services company. It has three operating segments: Community Banking, Wholesale Banking, and Wealth and Investment Management. The Company offers its services under three categories: personal, small business and commercial. It provides retail, commercial and corporate banking services through banking locations and offices, the Internet and other distribution channels to individuals, businesses and institutions in all 50 states, the District of Columbia and in other countries. It provides other financial services through its subsidiaries engaged in various businesses, including wholesale banking, mortgage banking, consumer finance, equipment leasing, agricultural finance, commercial finance, securities brokerage and investment banking, computer and data processing services, investment advisory services, mortgage-backed securities servicing and venture capital investment.
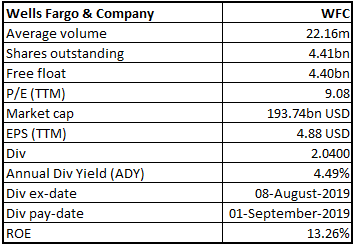
WFC Details
Asset Quality Improved with decline in Non-Performing Assets: Wells Fargo & Company (NASDAQ: WFC) offers financial services such as banking, insurance, mortgage, investments, etc., via three business segments - Community Banking, Wholesale Banking, and Wealth and Investment Management. With assets worth $1.9 trillion as on FY18, the company supports its customers through 7,800 locations, more than 13,000 ATMs, offices in 37 countries and territories. The company has built a remarkable history with a clear vision to enhance shareholders’ value along with consistently producing strong financial results. The passed 2018 year saw further strength and foundation build-up with new product and service offerings, improvements in the customer experience, improved operational efficiency, etc. The company continued to address past issues and rebuild trust with customers and stakeholders. WFC adopted few fundamental changes related to organizational structure, risk management, governance practices and oversight, etc. as a transformational process.
Looking at the past year performance, FY18 witnessed a generation of net income worth $22.4 billion as compared to $22.2 billion in FY17 along with EPS of $4.28, increased from $4.10 in FY17. During the period, average loans at $945.2 billion and average deposits at $1.3 trillion posted a yoy decline of 1% and 2%, respectively. ROA (return on assets) and ROE (return on equity), at the end of the period, stood higher at 1.19% and 11.53% from 1.15% and 11.35%, respectively, a year ago. The period was also characterized by a capital return of $25.8 billion to shareholders through dividends and additional share repurchases. The period was solid in terms of credit quality on account of strong performance witnessed by commercial and consumer real estate portfolio. NPAs (Non-performing assets) as at FY18 at $6.9 billion were 16% down on yoy. The company enjoyed a strong balance sheet with decent capital and liquidity in 2018. Common Equity Tier 1 ratio (CET1) was 11.74% at the end of FY18, mildly down from 11.98% in FY17, however, above the company’s internal target of 10%. As a result of anticipated net share repurchases, number of outstanding shares is likely to go down further in FY19.
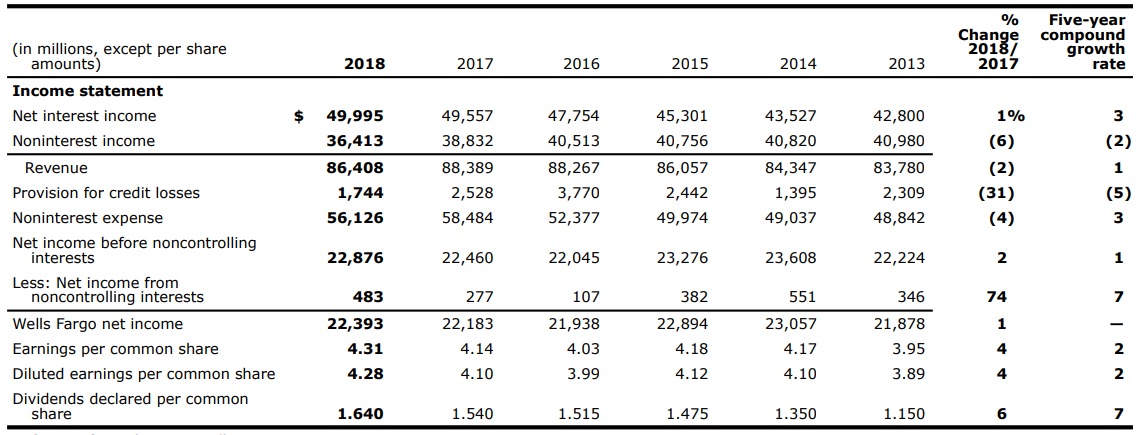
Six-Year Summary of Selected Financial Data (Source: Company Reports)
2Q FY19 Results Highlights: The company recently posted its quarterly results for the second quarter, which saw positive business momentum and strong customer activity with yoy growth in period-end loans and deposits.
Net Interest Income (NII) and Fee-Based Income: The company posted a decline of $216 million to $12.1 billion from 1Q19 with NIM (Net Interest Margin), down by 9 bps to 2.82%, primarily due to balance sheet mix and repricing. The fall was slightly offset by the additional one day in the quarter. The quarter posted non-interest income of $9.5 billion, up $191 million from the first quarter of 2019.
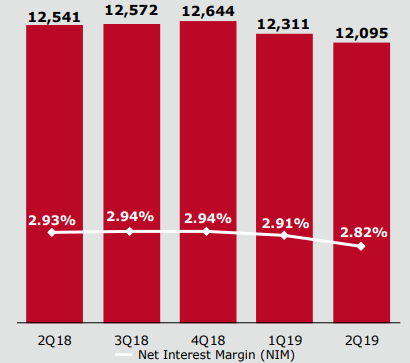
Net Interest Income, in $ million (Source: Company Reports)
Loan and Average Credit Loan: Total period-end loans came in at $949.9 billion with yoy growth of 1%. As at the end of the period, average loans stood at $947.5 billion, which was up by $3.4 billion on yoy basis but down by $2.6 billion from 1QFY19. Commercial loans posted a flat growth from 1Q19, largely on the back of lower commercial & industrial loans and commercial real estate construction loans. Consumer loans increased around $1.6 billion from the prior quarter, owing to the growth seen in first mortgage loans, auto loans and credit card loans, marginally offset by downtick in legacy consumer real estate loans.
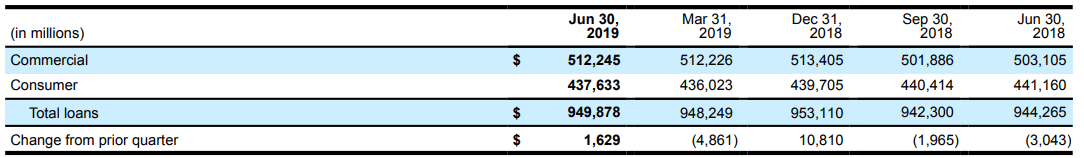
Commercial and Consumer Banking (Source: Company Reports)
Total average loan yield at 4.80% at the end of the quarter was down 4 bps (LQ) due to changes in loan mix and the repricing impacts of lower interest rates, and up 16 bps on yoy.
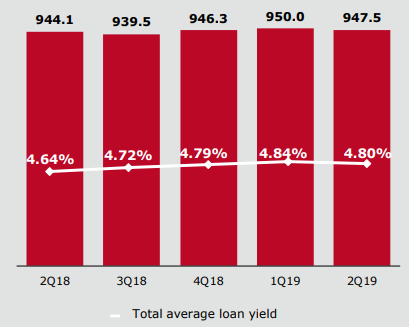
Average Loans Outstanding in $ bn (Source: Company Reports)
Average deposit trends and costs: Total average deposits for 2Q19 at $1.3 trillion were up by $6.9 billion from 1Q19 on higher commercial and mortgage escrow deposits. On yoy basis, average deposits were down $2.3 billion as a reflection of lower Wealth and Investment Management (WIM) and Wholesale Banking deposits as more cash was allocated to higher yielding liquid alternatives. The average deposit cost for the period was 70 bps, up 5 bps from the first quarter of 2019 and 30 bps from the prior year period.
Period-end deposits of $1.3 trillion were up $19.5 billion, or 2% on yoy with Wholesale Banking deposits up $37.4 billion or 10%, Corporate Treasury deposits down $5.0 billion or 5%, Mortgage escrow deposits up $4.0 billion or 19%, and Consumer and small business banking deposits down $12.0 billion or 2%.
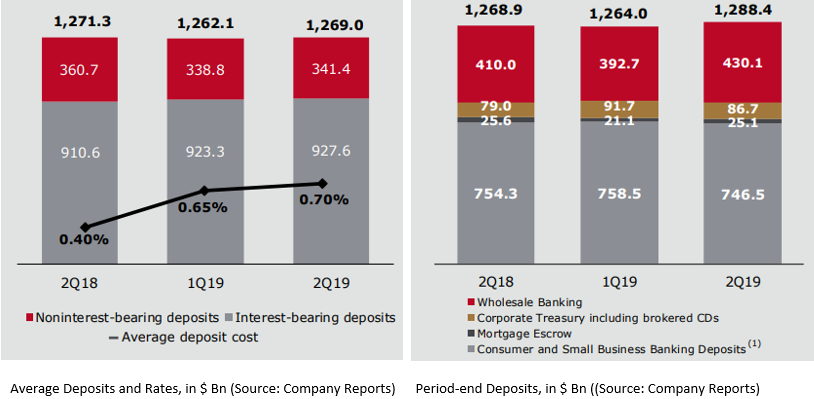
Average deposit trends and costs (Source: Company Reports)
Non-interest Expense and Efficiency Ratio: The period saw a decline of $467 million from the prior quarter to $13.4 billion, owing to a decline in employee benefits expense and incentive compensation expense. However, higher outside professional and contract services, salary, and advertising and promotion expense offset the decline. With this, efficiency ratio came in at 62.3% in 2QFY19 as compared to 64.4% in 1QFY19.
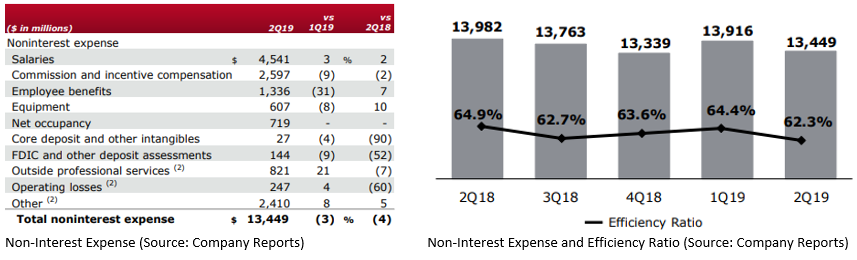
Non-interest Expense and Efficiency Ratio (Source: Company Reports)
Non-Performing Assets: Asset quality improved for the quarter with NPAs falling by $1.0 billion or 14%, from 1QFY19 to $6.3 billion. Non-accrual loans witnessed a decline of $983 million from 1QFY19 to $5.9 billion. Commercial non-accrual loans posted a fall due to the reduced commercial and industrial portfolio reflecting broad-based improvement across industry sectors. Consumer non-accrual loans also saw a fall on account of lower non-accruals in the real estate 1-4 family first mortgage portfolio.
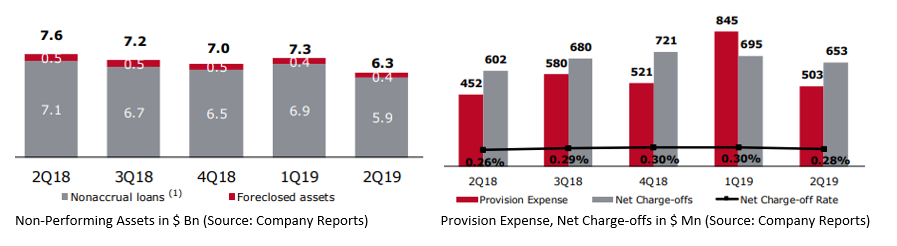
Non-Performing Assets Trend (Source: Company Reports)
Segment-wise Performance: The company defines its net income through three business segments, of which the major part is contributed by community banking, followed by wholesale banking and wealth and investment banking.
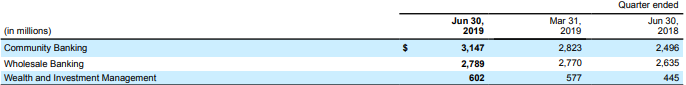
Segment Wise- Net Income (Source: Company Reports)
During Q2FY19, Community Banking segment saw a yoy growth of 26% in net income to $3,147 million and 11% growth on the previous quarter. For the segment, Revenue at $11.8 billion was flat as compared to the previous quarter as well a year ago. Non-interest expense of $7.2 billion witnessed a decline of $477 million or 6% from the previous quarter and a decrease of $78 million or 1% on account of lower personnel expense and lower deferred compensation expense. The segment posted a less provision for credit losses by $231 million on account of credit improvement in few sector portfolios.
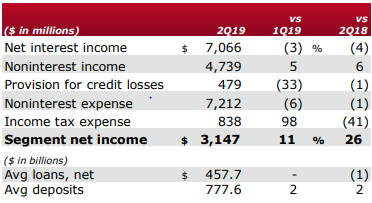
Community Banking- Key Metrics (Source: Company Reports)
With respect to the Wholesale Banking segment, Net income grew by 6% to ~$2.8 billion in Q2FY19 on Y-o-Y basis, indicating lower operating losses whereas net income was up 1% on the previous quarter due to lower provision for credit losses. Revenue from treasury management grew by 1% on yoy and 4% on last quarter, owed to low 1Q volumes. YTD US investment banking market share came in at 3.5% against YTD 2018 of 3.3%.
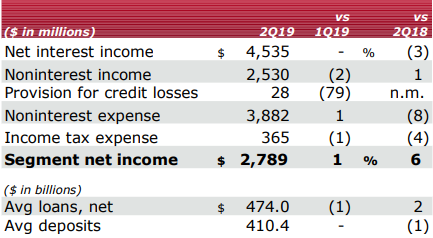
Wholesale Banking – Key Metrics (Source: Company Reports)
Besides this, Wealth and Investment Management segment posted excellent yoy growth of 35% in net income to $602 million. The higher growth can be attributed to the inclusion of the Rock Creek other-than-temporary impairment in Q2FY18. Net interest income posted a de-growth of 6% from last quarter due to lower deposit balances.
Balance Sheet and Capital Management: Looking at the capital position, CET1 ratio stood at 12% as on 30 June 2019, which was well above the regulatory norms of 9% as well as the company’s internal target of 10%. Total stockholders’ equity for the period grew by ~$1.2 billion to $199 billion on account of increased retained earnings and cumulative OCI (other comprehensive income) on balance sheet. Total outstanding shares of WFC were down 92.4 million shares, owing to share repurchases event by the company. The company continued to de-risk the balance sheet and consistent profitability assisted in maintaining the capital levels above prescribed by the regulatory authorities. Hence, to meet the requirements and internal targets, the company returned the capital to shareholders worth $6.1 billion in the quarter, which was up 52% from the prior corresponding period. During the quarter, the company announced a dividend of $0.45 per share, which was up 15% on yoy.
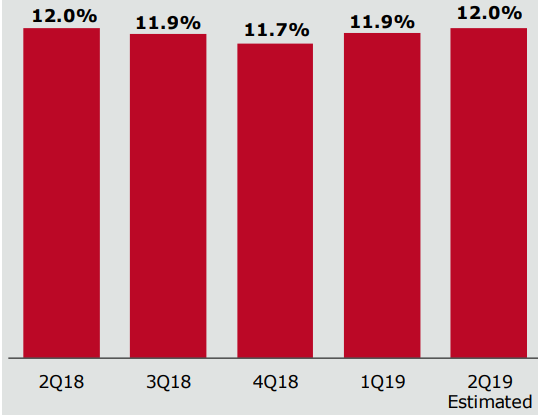
Common Equity Tier 1 Ratio Capital Position (Source: Company Reports)
Key Metrics: Net interest margin for 2QFY19 stood at 2.82%, mildly below the prior corresponding period. Efficiency ratio at 62.3% for the period was slightly above the industry median of 62.1%. Loan and deposit posted a decent growth of 0.2% and 1.9%, respectively in the quarter against the de-growth seen in the previous quarter and a year ago period.
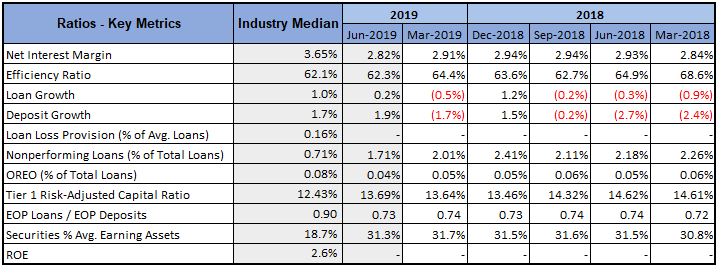
Key Ratio Metrics (Source: Thomson Reuters)
Top 10 Shareholders: The top 10 shareholders have been highlighted in the table, which together form around 33.80% of the total shareholding. Berkshire Hathaway Inc. and The Vanguard Group, Inc. hold the maximum interest in the company at 9.30% and 7.36%, respectively.
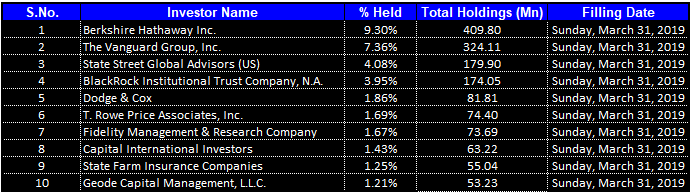
Top 10 Shareholders (Source: Thomson Reuters)
FY19 Guidance: The company is aiming at non-interest expense target of $52 billion to $53.0 billion in FY19 and currently expecting the non-interest expense to be close at the higher end of the given range as higher ongoing investment spend offsets the expense efficiencies.
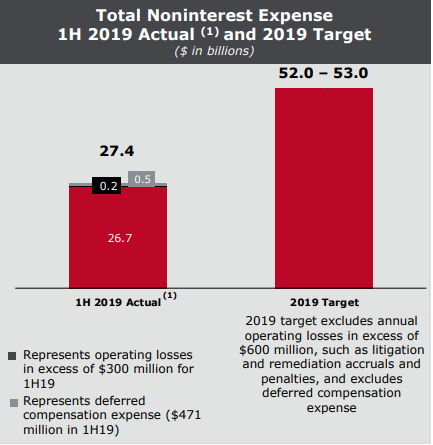
Total Non-interest Expense 1H 2019 Actual and 2019 Target, in $ Bn (Source: Company Reports)
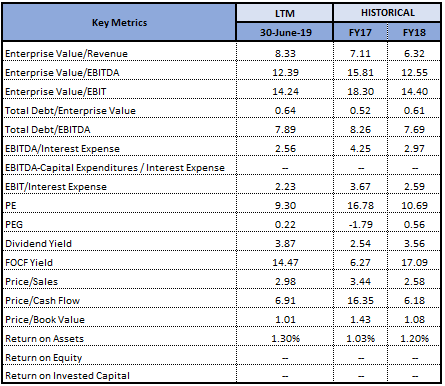
Key Valuation Metrics (Source: Thomson Reuters)
Valuation Methodology: Price to Book Value Based Valuation (NTM):
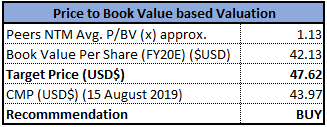
Price/Book Value Based Valuation (Source: Thomson Reuters), *NTM-Next Twelve Months
Note: All forecasted figures and peers have been taken from Thomson Reuters, *NTM-Next Twelve Months
Stock Recommendation: At the current market price of $43.97, the stock is trading at a price to earnings multiple of 9.08x. Annualized dividend for the stock comes in at $2.04 with the current yield at 4.49%. With a net income of $6.2 billion and diluted EPS of $1.30 in 2QFY19, the company showed a decent set of return ratios with ROA and ROE at 1.31% and 13.26%, respectively. The quarter was highlighted by yoy growth in period-end loans and deposits, increased debit and credit card usage on yoy basis, higher loan originations in first mortgage and auto on yoy basis, etc. Moreover, the amount returned to the shareholders through dividends and net share repurchases at $6.1 billion was higher as compared to $4.0 billion in Q218. During the quarter, the company announced a dividend of $0.45 per share with ex-dividend on 08 August 2019. Based on the foregoing, we have valued the stock using relative valuation method, Price to Book Value multiple and have arrived at the target price of high single-digit growth (in %)). Hence, we recommend a “Buy” rating on the stock at the current market price of $43.97 per share, down 4.33% on 15 August 2019.
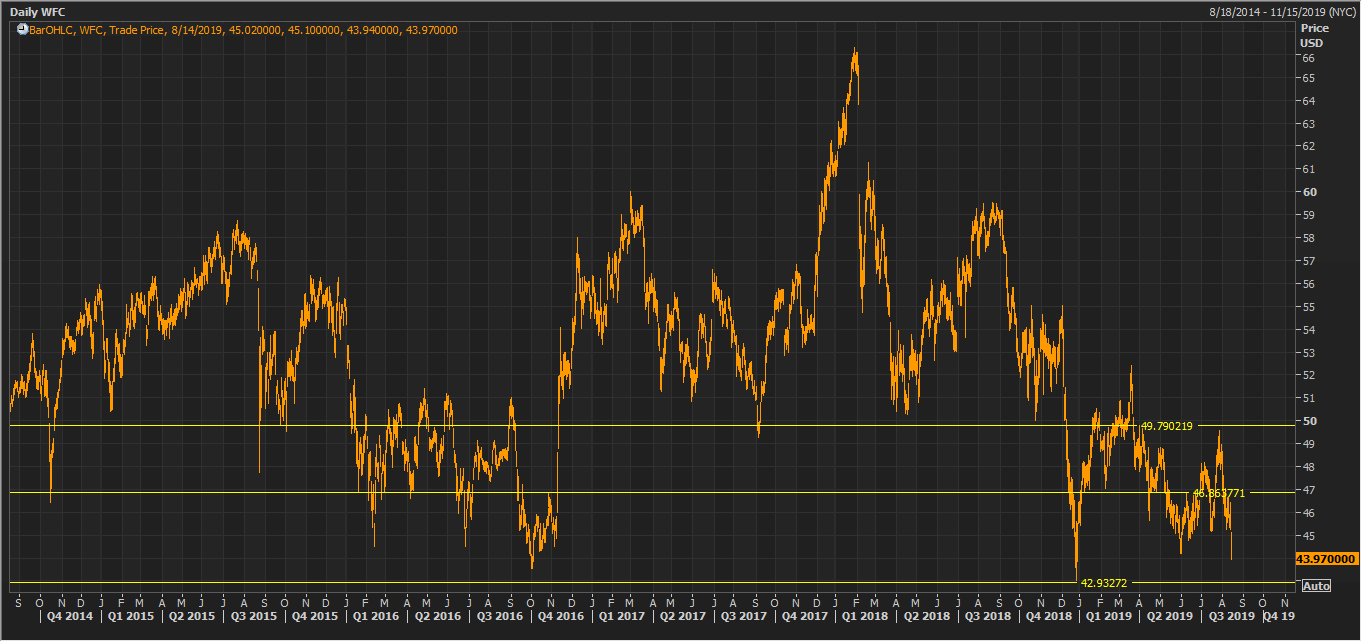
WFC Daily Technical Chart (Source: Thomson Reuters)
Disclaimer
The advice given by Kalkine Pty Ltd and provided on this website is general information only and it does not take into account your investment objectives, financial situation or needs. You should therefore consider whether the advice is appropriate to your investment objectives, financial situation and needs before acting upon it. You should seek advice from a financial adviser, stockbroker or other professional (including taxation and legal advice) as necessary before acting on any advice. Not all investments are appropriate for all people. Kalkine.com.au and associated pages are published by Kalkine Pty Ltd ABN 34 154 808 312 (Australian Financial Services License Number 425376). The information on this website has been prepared from a wide variety of sources, which Kalkine Pty Ltd, to the best of its knowledge and belief, considers accurate. You should make your own enquiries about any investments and we strongly suggest you seek advice before acting upon any recommendation. Kalkine Pty Ltd has made every effort to ensure the reliability of information contained in its newsletters and websites. All information represents our views at the date of publication and may change without notice. To the extent permitted by law, Kalkine Pty Ltd excludes all liability for any loss or damage arising from the use of this website and any information published (including any indirect or consequential loss, any data loss or data corruption). If the law prohibits this exclusion, Kalkine Pty Ltd hereby limits its liability, to the extent permitted by law to the resupply of services. There may be a product disclosure statement or other offer document for the securities and financial products we write about in Kalkine Reports. You should obtain a copy of the product disclosure statement or offer document before making any decision about whether to acquire the security or product. The link to our Terms & Conditions has been provided please go through them and also have a read of the Financial Services Guide. On the date of publishing this report (mentioned on the website), employees and/or associates of Kalkine Pty Ltd do not hold positions in any of the stocks covered on the website. These stocks can change any time and readers of the reports should not consider these stocks as personalised advice.
 Please wait processing your request...