Kalkine has a fully transformed New Avatar.

Company Overview: Vicinity Centres is an Australia-based retail property company. The principal activities of the Company includes property investment, property management, property development, leasing and funds management. It operates through two segment: Property Investment and Strategic Partnerships. Property Investment comprises net property income derived from investment in retail property. Strategic Partnerships includes fee income from providing property management, development and leasing services to third parties, and management of wholesale property funds. Its portfolio includes various shopping center types, such as super regional, major regional, city Centre, regional, outlet center, sub regional and neighborhood. The Company’s portfolio includes 62 shopping centers. It owns and operates shopping centers across various locations, including New South Wales, Queensland, South Australia, Tasmania, Victoria and Western Australia.
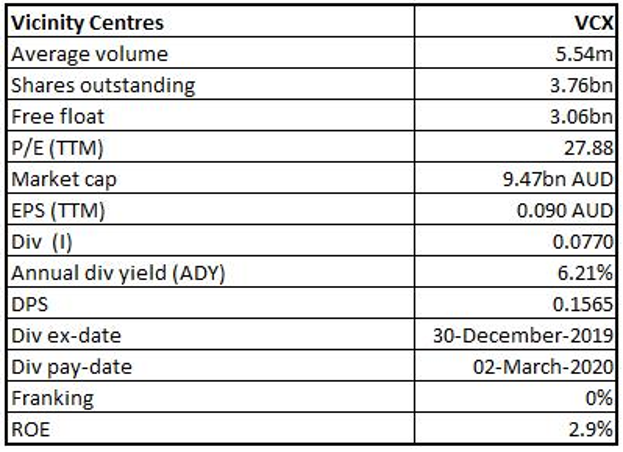
VCX Details
Decent Performance in FY19 Amidst Challenging Retail Environment: Vicinity Centres (ASX: VCX) is a mid-to-large-cap real estate investment trust company with the market capitalisation of ~$ 9.47 Bn as of 30 January 2020. Amidst challenging retail environment, the company delivered decent FY19 results with an occupancy rate of 99.5%. In FY19, funds from operations (FFO) of $689.3 Mn and distribution of $604.5 Mn equates FFO payout ratio of 87.7%. On a comparable basis, FFO per security growth stood at 2.0%, due to comparable net property income growth of 1.5%, securities buy-back program and development completions. The company’s statutory net profit after tax stood at $346.1 million in FY19. The company continued to strengthen its portfolio through divestments, active asset management and progressing the developments, which will support to improve the portfolio metrics and better positioning of the company in the future.
VCX declared the distribution per security of 15.9 cents for FY19, in comparison to 16.3 cents in the previous year. The fall is mainly due to the impact of asset divestments in the previous 2 years and implies an adjusted FFO payout ratio of 99.8%. As per the release, final distribution for 6 months ended June 30, 2019 amounted to 7.95 cents per security. The company has divested 12 assets for the consideration of $670 million at a 3.9% discount to the book value. The company’s direct portfolio reduced from the interests in 88 assets which were valued at $14.3 billion at June 2015, to the interests in 62 assets which have been valued at $15.8 billion as at June 2019. Over the same time, specialty store MAT per sqm rose by 32%, average asset value increased 1.7 times, and the company has decreased the gearing by 90 basis points (or bps) and, at the same time, enhanced its investment grade credit ratings.
Given the backdrop of paying dividend consistently, enhancement in portfolio through active tenant remixing, and prudent execution of its business strategy, we have valued the stock using two relative valuation methods, i.e., P/E multiple and Price to Cash Flow multiple, and 3-year average P/E market multiples of ~15.05x to FY20E consensus EPS of $0.179 and have arrived at a target price upside of high single-digit (in percentage term). At CMP of $2.560, the stock of the company is trading at P/E multiple 14.30x of FY20E EPS.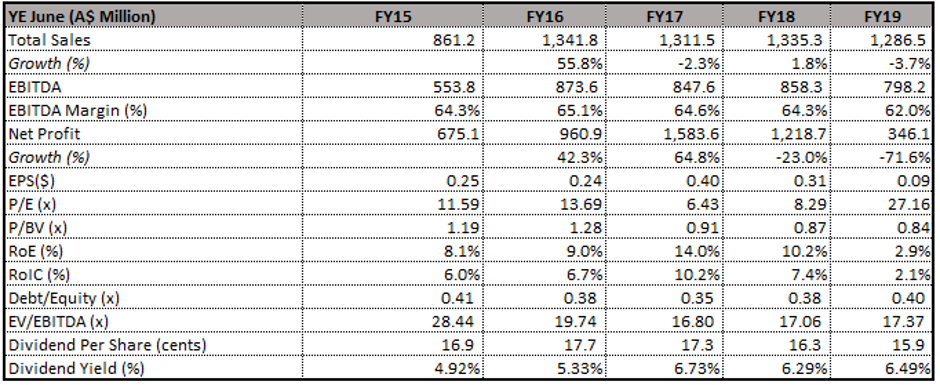
Key Financial Highlights (Source: Company Reports, Thomson Reuters)
Top 10 Shareholders: The following table provides a broader overview of the top 10 shareholders in Vicinity Centres: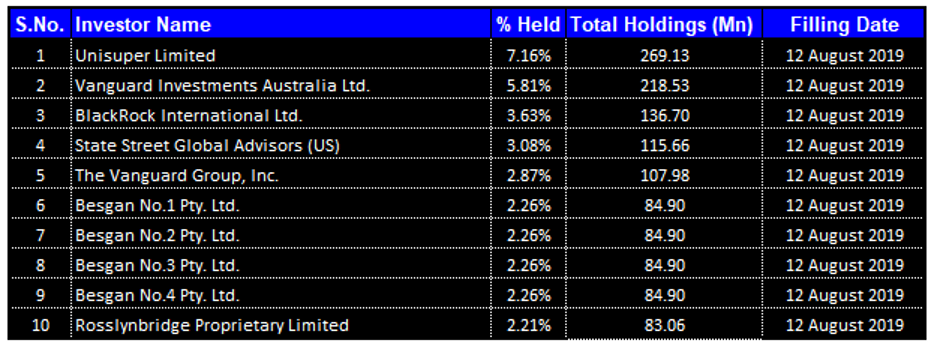
Top 10 Shareholders (Source: Thomson Reuters)
Results For Q1 FY 2020: The company has released its results for the quarter ended September 2019, wherein it was mentioned that the positive momentum has been maintained in specialty store sales growth, as the company has been executing on its strategy and has been further enhancing the portfolio via active tenant remixing, as well as progressing the retail and mixed-use development opportunities. The company’s key personnel stated that total portfolio MAT rose 2.6%. This was helped by solid specialty store and mini majors combined sales growth which was of 3.0% along with increased sales from DDS category, that was up 2.9%.
In the month of August 2019, final major stage of $430 million redevelopment of The Glen, VIC was wrapped up. As per the release issued, the centre has over 250 retailers, a new-format David Jones as well as a new indoor-outdoor dining precinct. Also, the construction has started on over 500 residential apartments at The Glen in largest air-rights deal above the retail centre in Australia.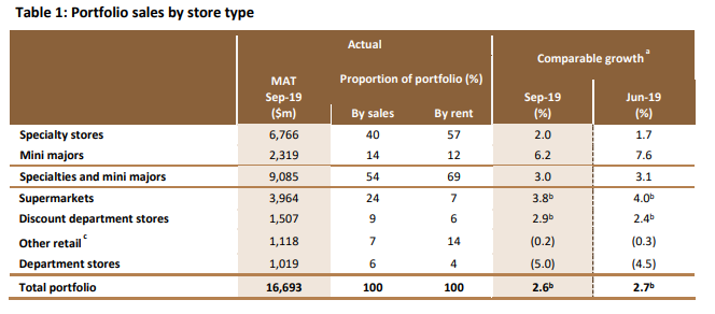
Portfolio Sales by Store Type (Source: Company Reports)
Overview of Margins: VCX’s gross margin stood at 72.5% in FY19, which is slightly higher than the industry median of 72.2%. Notably, the company’s net margin came in at 26.9% in FY19. Its Debt/Equity ratio stood at 0.40x as compared to the industry median of 0.41x and, therefore, it can be said that the company’s balance sheet is less leveraged as compared to the broader industry. Moreover, the company was able to convert its inventory to cash in a more efficient way than the prior year as its cash conversion cycle stood at 18.4 days for FY19 as compared to the prior year figure of 34.4 days. RoE and RoCE stood at 2.9% and 2.1%, respectively, in FY19.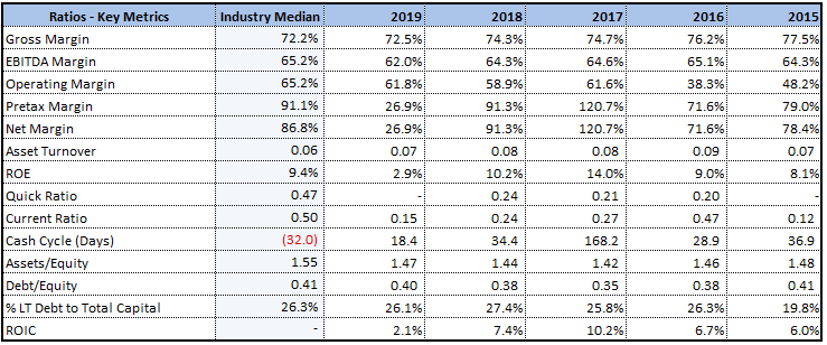
Key Metrics (Source: Thomson Reuters)
Pricing of €500 Mn of Medium-Term Notes: Vicinity Centres recently made an announcement that the company has priced €500 million (which is equivalent to around A$812 million) of 10-year fixed rate medium term notes under the European Medium-Term Note (or MTN) programme. The key personnel of the company demonstrated optimism as a strong response was received for inaugural Euro denominated MTN raising, that has resulted in highly competitive pricing for the notes. Apart from opening the new debt source of Euros, the notes would be extending the average duration, as well as reduce the average cost, of the financing facilities.
Divestment of 2 Non-core Assets: Vicinity Centres made an announcement about divestment of 2 non-core assets for the total consideration of $195.5 million, which implies a 0.5% discount to their combined June 2019 book values. The company’s key personnel stated that they have achieved solid pricing for the assets, after improved investor demand since it made an announcement in the month of August 2019 that they would not be proceeding with any further material divestments in the current environment. As per the release, the sale of the non-core assets happens to be in line with the company’s strategy of focusing the portfolio on market-leading destinations.
It was added that the transaction would be further strengthening the company’s balance sheet, and there might be approximately 90 basis point reduction in the gearing, and proceeds are expected to be used towards repayment of debt in the short term.
Acquisition of Interest in Uni Hill Factory Outlets, VIC: Vicinity Centres made an announcement that it has agreed for the acquisition of 50% interest in Uni Hill Factory Outlets in Victoria. This would be made from MAB Corporation for the consideration amounting to $67.8 million. As per the release, MAB Corporation would be retaining 50% interest in the asset. The company has also made an announcement about the divestment of 50% interest in Lennox Village in New South Wales at June 30, 2019 book value of $31.5 Mn. This has been done to joint-owner Challenger, in a simultaneous exchange and settlement on December 11, 2019.
Decent Payout Ratio Might Attract Dividend Investors: The company declared a full-year distribution per security amounting to 15.9 cents (i.e., 7.95 cents for both the half-year periods), as compared to 16.3 cents in the previous year. The decline was mainly because of the impact of asset divestments and implies an adjusted FFO (or AFFO) payout ratio of 99.8%. The company is expecting a distribution payout ratio in the upper end of the target range which is 95% to 100% of the adjusted FFO. The annual dividend yield of the company is about 5.95% on a five-year average basis (FY15-19). At the current market price of $2.560, the company’s annual dividend yield stood at 6.21%, which is higher than the industry average (Real Estate) of 4.2% and, thus, it looks like that VCX has been generating decent income for its shareholders which might attract the attention of dividend-seeking investors.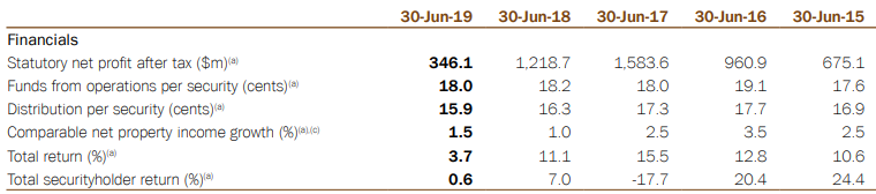
Distribution Per Security (Source: Company Reports)
What to Expect From VCX: As previously stated, VCX announced divestment of 2 non-core assets for the total consideration of $195.5 million. As per the release, the proceeds as a result of divestment would be initially utilised to repay the floating debt. The expected impact on FFO isaround 0.3 cents per security reduction on an annualised basis, and this is prior to any reinvestment of the proceeds. Because of the expected timing of the settlement of asset sales, the forecast impact on the company’s FY 2020 FFO is around 0.2 cents per security. Its FY 2020 FFO per security guidance was reduced from 17.8 to 18.0 cents to 17.6 to 17.8 cents. However, the distribution payout ratio happens to be unchanged at the upper end of the target range of 95% to 100% of the adjusted FFO.
Valuation Methodologies:
Method 1: P/E Based Relative Valuation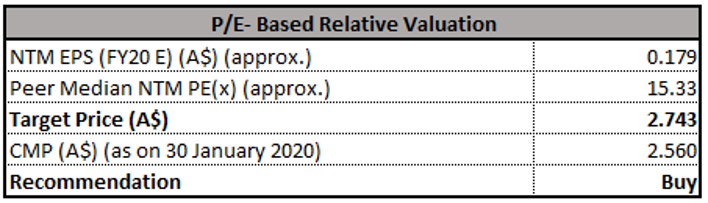
P/E based relative valuation (Source: Thomson Reuters)
Method 2: P/CF Based Relative Valuation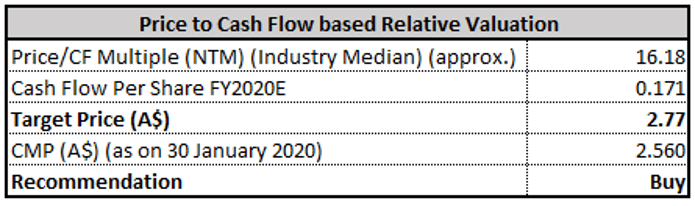
Price to cash flow based relative valuation (Source: Thomson Reuters)
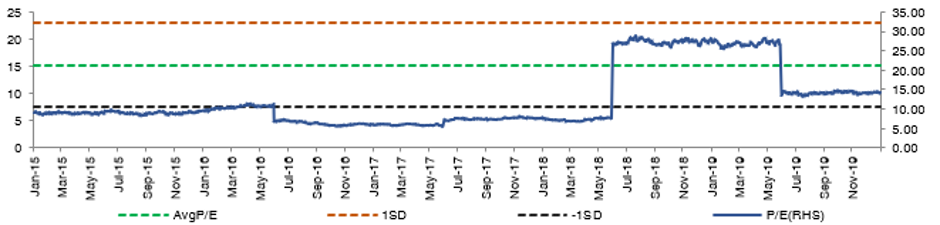
Method 3: PE Market Multiple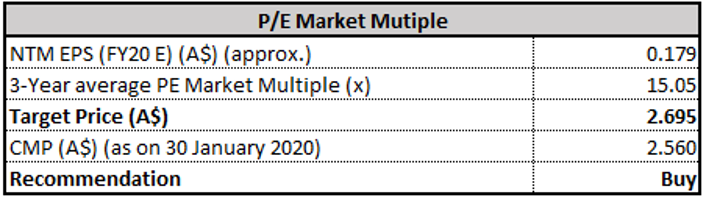
PE Market Multiple (Source: Thomson Reuters)
Note: All forecasted figures and peers have been taken from Thomson Reuters, *NTM: Next Twelve Months
Historical Price Band (Source: Thomson Reuters)
Stock Recommendation: Vicinity Centres has agreed to acquire 50% interest in Uni Hill Factory Outlets, VIC and the company has divested Lennox Village, NSW. The company’s key personnel stated that the transactions represent a continuation of the company’s strategic portfolio refinement as well as focus towards the market-leading destinations, via divestment of the non-core assets and reinvesting the proceeds towards value-accretive acquisitions and developments. The company’s total revenues have witnessed a CAGR growth of 10.55% between FY15- FY19 and, therefore, it can be said that VCX is possessing decent capabilities to generate revenues which could help it in achieving long-term growth objectives. Given the backdrop of paying dividend consistently, enhancement in portfolio through active tenant remixing, and prudent execution of its business strategy, we have valued the stock using two relative valuation methods, i.e., P/E multiple and Price to Cash Flow multiple, and 3-year average P/E market multiples of ~15.05x to FY20E consensus EPS of $0.179 and have arrived at a target price upside of high single-digit (in percentage term). Hence, we give a “Buy” recommendation on the stock at the current market price of A$2.560 per share (up 1.587% on 30 January 2020).
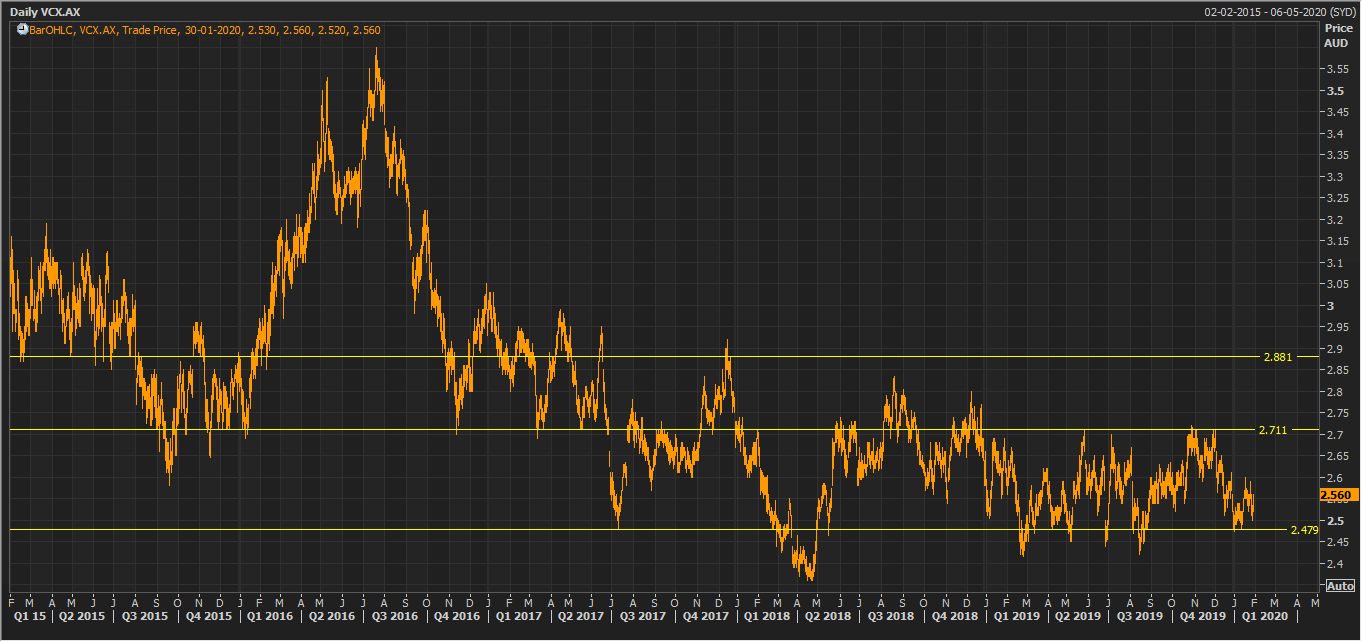
VCX Daily Technical Chart (Source: Thomson Reuters)
Disclaimer
The advice given by Kalkine Pty Ltd and provided on this website is general information only and it does not take into account your investment objectives, financial situation or needs. You should therefore consider whether the advice is appropriate to your investment objectives, financial situation and needs before acting upon it. You should seek advice from a financial adviser, stockbroker or other professional (including taxation and legal advice) as necessary before acting on any advice. Not all investments are appropriate for all people. Kalkine.com.au and associated pages are published by Kalkine Pty Ltd ABN 34 154 808 312 (Australian Financial Services License Number 425376). The information on this website has been prepared from a wide variety of sources, which Kalkine Pty Ltd, to the best of its knowledge and belief, considers accurate. You should make your own enquiries about any investments and we strongly suggest you seek advice before acting upon any recommendation. Kalkine Pty Ltd has made every effort to ensure the reliability of information contained in its newsletters and websites. All information represents our views at the date of publication and may change without notice. To the extent permitted by law, Kalkine Pty Ltd excludes all liability for any loss or damage arising from the use of this website and any information published (including any indirect or consequential loss, any data loss or data corruption). If the law prohibits this exclusion, Kalkine Pty Ltd hereby limits its liability, to the extent permitted by law to the resupply of services. There may be a product disclosure statement or other offer document for the securities and financial products we write about in Kalkine Reports. You should obtain a copy of the product disclosure statement or offer document before making any decision about whether to acquire the security or product. The link to our Terms & Conditions has been provided please go through them and also have a read of the Financial Services Guide. On the date of publishing this report (mentioned on the website), employees and/or associates of Kalkine Pty Ltd do not hold positions in any of the stocks covered on the website. These stocks can change any time and readers of the reports should not consider these stocks as personalised advice.
Past performance is not a reliable indicator of future performance.
 Please wait processing your request...