Kalkine has a fully transformed New Avatar.

Company Overview: Vicinity Centres is an Australia-based retail property company. The principal activities of the Company includes property investment, property management, property development, leasing and funds management. It operates through two segment: Property Investment and Strategic Partnerships. Property Investment comprises net property income derived from investment in retail property. Strategic Partnerships includes fee income from providing property management, development and leasing services to third parties, and management of wholesale property funds. Its portfolio includes various shopping center types, such as super regional, major regional, city Centre, regional, outlet center, sub regional and neighborhood. The Company’s portfolio includes 62 shopping centers. It owns and operates shopping centers across various locations, including New South Wales, Queensland, South Australia, Tasmania, Victoria and Western Australia
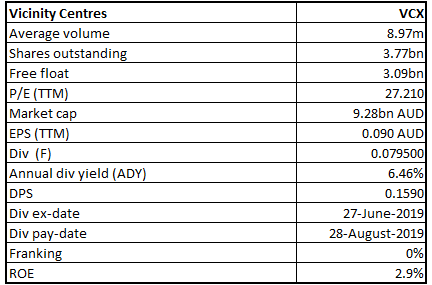
VCX Details
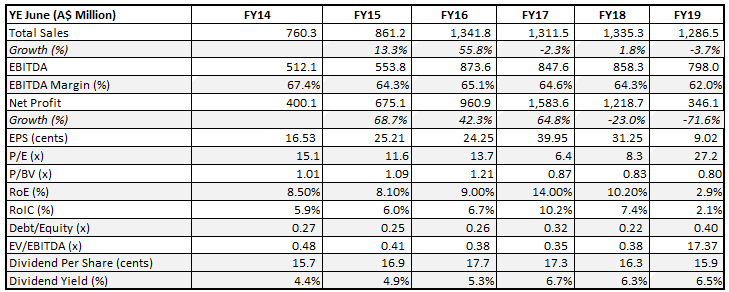
Decent Performance in FY19 Amidst Certain Challenges: Vicinity Centres (ASX: VCX) is mainly engaged in the business of property investment, property development, property management, leasing and funds management. As on August 22, 2019, the market capitalisation of Vicinity Centres stood at ~A$9.28 billion. VCX has recently announced its results for 12 months ended June 30, 2019, in which its FFO amounted to $689.3 million or 18.0 cents on per security basis. On a comparable basis, FFO per security growth stood at 2.0%, driven by comparable net property income (NPI) growth of 1.5%, development completions and VCX’s securities buy-back. However, its statutory net profit after tax amounted to $346.1 million. The company’s CEO and Managing Director reflected positive views with respect to its FY19 results and added that the company posted robust financial result amidst the challenging retail environment, which demonstrates the strength and resilience of its portfolio and execution of the strategy that it started a year ago. The company continued to strengthen its portfolio via divestments, active asset management and progressing its developments, resulting in the improved portfolio metrics and better positioning VCX for the future.
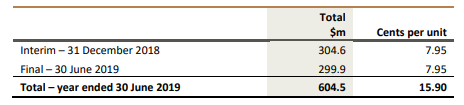
The company added that the distribution per security amounted to 15.9 cents for FY19 as compared to 16.3 cents in the prior year. The decrease was mainly because of the impact of the asset divestments over the last two years and reflected adjusted FFO (or AFFO) payout ratio of 99.8%. Also, it was added that the final distribution for six months ended June 30, 2019 stood at 7.95 cents per security and would be paid to the securityholders on August 28, 2019. VCX’s 62 directly-owned retail properties were revalued during the year, and flagship portfolio of Chadstone, premium CBD and DFO assets, recorded robust gains, averaging 3.7% net uplift. The company’s key personnel stated that its balance sheet was robust, and the investment grade credit ratings were stable. Additionally, it was stated that the gearing stood at 27.1%, which is at the lower end of the target range of 25%- 35%, and the company has well-diversified funding sources. It looks like the balance sheet position along with the diversified funding sources might help the company in witnessing growth moving forward. There are expectations that the retail environment might be challenging in FY20, though economic stimulus, which includes the lower interest rates and income tax cuts could benefit the retail spending. At CMP of $2.460, VCX has an annual dividend yield of 6.46%, which is higher than the industry median (Residential & Commercial REITs) of 5.2%, and that might the help VCX to gain traction among the market players and, thus, it might attract the attention of the dividend-seeking investors. Moving forward, there are expectations that VCX’s robust balance sheet, focus on operational efficiency, and decent capabilities to generate revenues might act as tailwinds for the overall growth. Also, the company stated that the economic stimulus might benefit retail sales in FY20. VCX also has diversified funding sources.
Considering these factors, we have valued the stock using two relative valuation methods, Price/Earnings ratio and Price/ Cash flow ratio and three-year average P/E of 15.0x for FY20E with consensus EPS of $0.178 and have arrived at target price upside of about high single-digit growth (in %). At CMP of A$2.460, VCX is trading at a PE multiple of 13.82x FY20E earnings.
Key Financial Highlights (A$ Mn) (Source: Company Reports, Thomson Reuters)
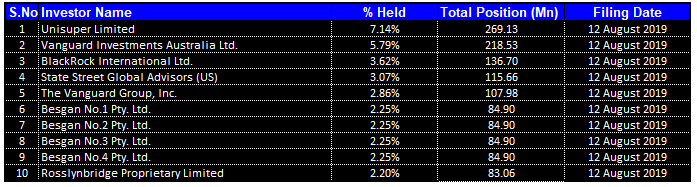
Top 10 Shareholders: The following table provides a broader idea of the top 10 shareholders in Vicinity Centres:
Top 10 Shareholders (Source: Thomson Reuters)
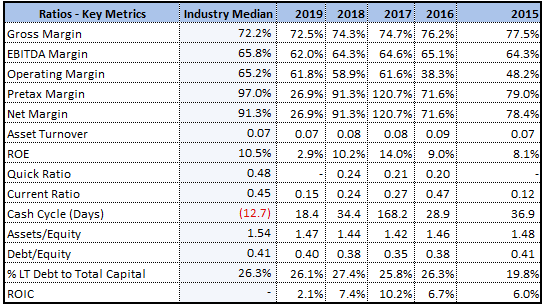
Reduction in Percentage of Long-term Debt: Vicinity Centres has a decent standing with respect to its key margins in FY19 as its operating margin stood at 61.8%, which reflects a rise of 2.9% on a YoY basis. However, in FY19, its gross margin stood at 72.5%. The company’s cash cycle (in days) has reduced to 18.4 days in FY19 from 34.4 days . RoE came in at 2.9% in FY19. Additionally, the company’s percentage of long-term debt to total capital stood at 26.1% in FY19, which reflects a fall of 1.3% on a YoY basis. The lesser exposure to the long-term debt component can be considered as positive as it reduces the long-term commitments. Additionally, the company’s Debt/ Equity ratio stood at 0.40x, which is marginally lower than the industry median of 0.41x.
Key Metrics (Source: Thomson Reuters)
Key Takeaways from Financial Report of Vicinity Centres Trust: Vicinity Centres RE Ltd, which is the responsible entity (or RE) of Vicinity Centres Trust, presented the financial report of Vicinity Centres Trust and its controlled entities for the year ended June 30, 2019. The statutory net profit after tax of Trust Group for the year ended June 2019 amounted to $319.4 million, which reflects a fall of $856.2 million on the prior year. The decrease was mainly because of $239.3 million revaluation decrement on the directly owned investment properties. The statutory result highlights for FY19 included the basic earnings per unit amounting to 8.34 cents and distributions per unit, which were 15.9 cents.
Distributions (Source: Company Reports)
Additionally, AUD $460.0 million bonds were issued under European Medium Term Note (or EMTN) and Australian Medium Term Note (or AMTN) programs. Also, a 5-year AUD $300.0 million bank debt facility was established with the new lender. Further, maturities for a number of bank debt facilities, which totalled $1.25 billion were extended by 12-13 months.
Overview of Direct Portfolio Property Book June 2019: In the book, it was added that Vicinity’s directly portfolio consisted of ownership interests in 62 shopping centres throughout Australia, and the value stood at $15.8 billion. The direct portfolio garnered annual retail sales amounting to $16.5 billion, throughout 2.5 million square metres of gross lettable area. Also, it was stated that Vicinity's premium CBD centres represent 16% of direct portfolio's value. Vicinity’s Direct Portfolio is close to the full occupancy at 99.5%. The following table provides an idea of the key statistics:
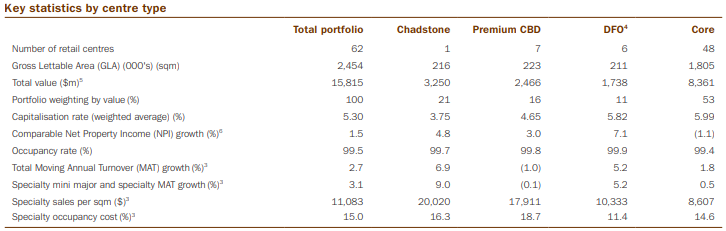
Key Statistics by Centre Type (Source: Company Reports)
Strengthening of Portfolio: In the past 12 months, VCX divested 12 assets for the consideration amounting to $670 million at 3.9% discount to the book value. The capital recycling since merger positioned Vicinity’s portfolio for the long-term growth. Vicinity’s direct portfolio reduced from interests in 88 assets valued at $14.3 billion at June 2015, to interests in 62 assets valued at $15.8 billion at June 2019. Over this time, specialty store MAT per sqm witnessed an increase of 32%, average asset value increased 1.7 times, and the company has decreased gearing by 90 bps and its investment grade credit ratings have been enhanced.
While Vicinity’s portfolio metrics strengthened in FY19, Western Australian (or WA) portfolio impacted the performance, with leasing spreads of -15.0% and comparable NPI down 2.5%, as compared to +0.5% and up 2.0% respectively for the remainder of the portfolio. However, there are potential signs of improvement in WA, and there was 4.7% sales growth in the quarter ended June 2019.
Annual Dividend Yield Higher than Industry Median: The company stated that the full-year distribution per security amounted to 15.9 cents as compared to 16.3 cents in FY18. The decrease was mainly because of the impact of asset divestments over the past two years and reflected an adjusted FFO payout ratio of 99.8%. Additionally, it was added that the distribution payout ratio has been anticipated to be at the upper end of 95% to 100% of the adjusted FFO.
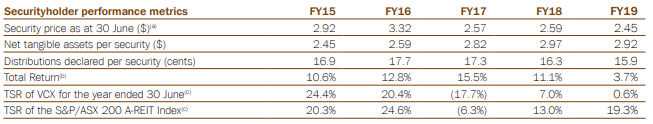
Securityholder Performance Metrics (Source: Company Reports)
The annual dividend yield of the company is about 6.0% on a five-year average basis (FY15-19). As per ASX, the company is having an annual dividend yield of 6.46%, which is higher than the industry median (Financials) of 5.0%, and that might the help VCX to gain traction among the market players.
What to Expect from VCX Moving Forward: During the year, Vicinity made strong progress on the $3.3 billion (VCX’s share: $1.9 billion) development pipeline. In October, they opened DFO Perth, which is 100% leased and is trading from day one. They continued to elevate Chadstone’s market-leading status, expanding luxury precinct with first-to-market brands and flagships, new visitor lounge, valet parking and new destination and casual dining offers. It was added that transformational development at Chatswood Chase Sydney happens to be in the advanced planning and development approval has been granted and construction is expected to begin in mid-2020.
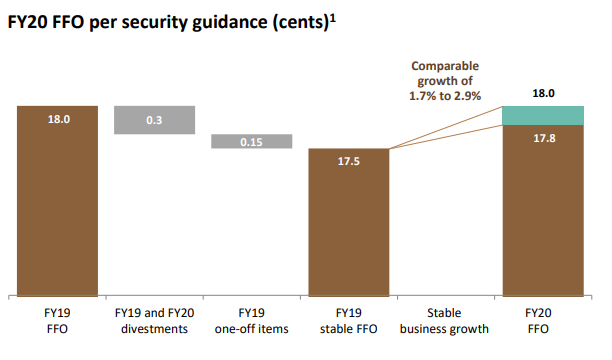
FY 2020 FFO per Security Guidance (cents) (Source: Company Reports)
VCX’s guidance for FFO for FY 2020 is in the range of 17.8 to 18.0 cents per security, which reflects comparable growth of 1.7%- 2.9%. The distribution payout ratio has been anticipated to be at the upper end of the target range of 95%- 100% of AFFO and reflects FY20 maintenance capital expenditure and incentives of around $80 million to $90 million. The company is focusing on the sustainable cost efficiency and it was added that they are utilising technology and data in order to drive the efficiencies and limit the cost growth.
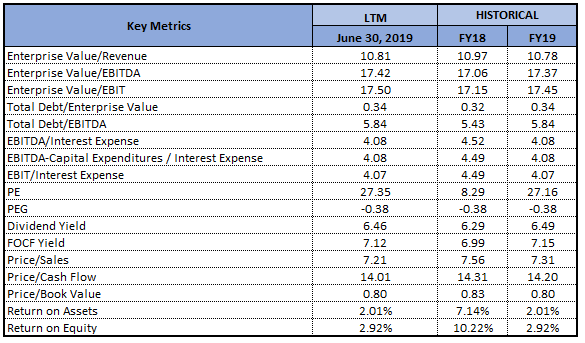
Key Valuation Metrics (Source: Thomson Reuters)
Valuation Methodologies:
Method 1: PE Based Valuation (NTM):
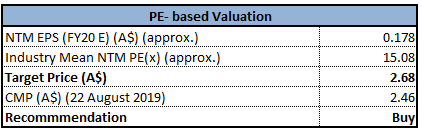
PE-Based Valuation (Source: Thomson Reuters), *NTM-Next Twelve Months
Method 1: Price/Cash Flow Based Valuation (NTM):
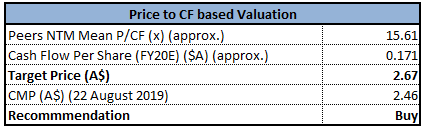
Price/Cash Flow-Based Valuation (Source: Thomson Reuters), *NTM-Next Twelve Months
Note: All forecasted figures and peers have been taken from Thomson Reuters, *NTM-Next Twelve Months
.png)
Historical PE Band (Source: Thomson Reuters, Company Reports)
Stock Recommendation: The stock of Vicinity Centres has witnessed a fall of 3.53% in the time span of previous one month while, in the horizon of past three months, the stock has fallen 6.46%. As per ASX, the company’s stock is trading closer to its 52-week low and, thus, it can be said that the stock is offering decent opportunity for accumulation. Also, VCX has been advancing plans for several retail and mixed-use developments and it was stated that the development applications have been anticipated to be lodged in 2020 for the Box Hill Central and Bankstown Central. The company stated that 5 projects are in the detailed planning at Chadstone. From the analysis standpoint, top-line has witnessed a CAGR growth of 10.55% between the time span of FY15- FY19 and, therefore, it can be said that the company has decent revenue-generation capabilities. During the same time period, its cash from operating activities encountered a CAGR growth of 12.19% and, thus, it looks like that the company is possessing decent operational capabilities. Considering these factors, we have valued the stock using two relative valuation methods, Price/Earnings ratio and Price/ Cash flow ratio and three-year average P/E of 15.0x for FY20E with consensus EPS of $0.178 and have arrived at target price upside of about high single-digit growth (in %). Hence, in view of aforesaid facts, we give a “Buy” recommendation on the stock at the current market price of A$2.460 per share.
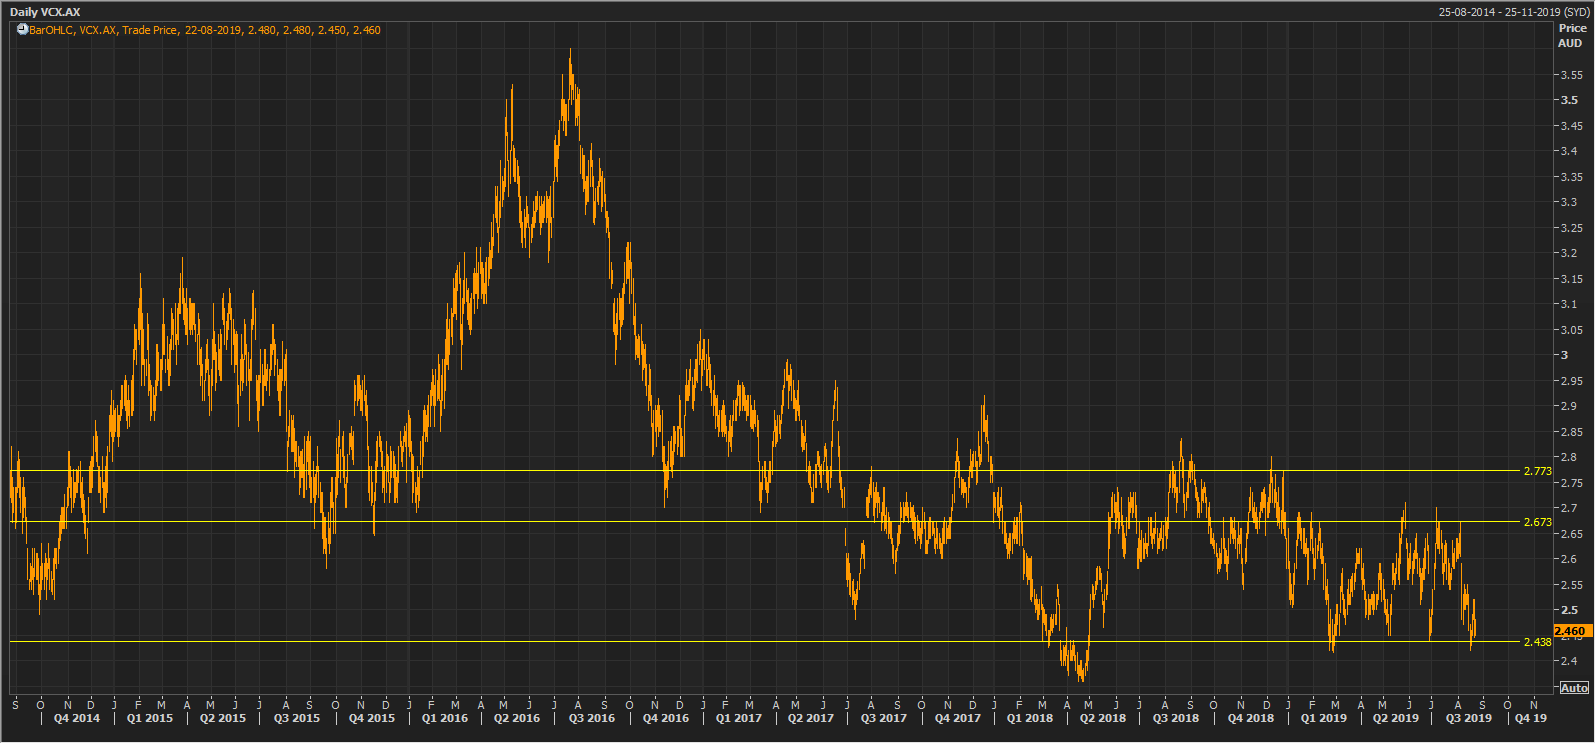
VCX Daily Technical Chart (Source: Thomson Reuters)
Disclaimer
The advice given by Kalkine Pty Ltd and provided on this website is general information only and it does not take into account your investment objectives, financial situation or needs. You should therefore consider whether the advice is appropriate to your investment objectives, financial situation and needs before acting upon it. You should seek advice from a financial adviser, stockbroker or other professional (including taxation and legal advice) as necessary before acting on any advice. Not all investments are appropriate for all people. Kalkine.com.au and associated pages are published by Kalkine Pty Ltd ABN 34 154 808 312 (Australian Financial Services License Number 425376). The information on this website has been prepared from a wide variety of sources, which Kalkine Pty Ltd, to the best of its knowledge and belief, considers accurate. You should make your own enquiries about any investments and we strongly suggest you seek advice before acting upon any recommendation. Kalkine Pty Ltd has made every effort to ensure the reliability of information contained in its newsletters and websites. All information represents our views at the date of publication and may change without notice. To the extent permitted by law, Kalkine Pty Ltd excludes all liability for any loss or damage arising from the use of this website and any information published (including any indirect or consequential loss, any data loss or data corruption). If the law prohibits this exclusion, Kalkine Pty Ltd hereby limits its liability, to the extent permitted by law to the resupply of services. There may be a product disclosure statement or other offer document for the securities and financial products we write about in Kalkine Reports. You should obtain a copy of the product disclosure statement or offer document before making any decision about whether to acquire the security or product. The link to our Terms & Conditions has been provided please go through them and also have a read of the Financial Services Guide. On the date of publishing this report (mentioned on the website), employees and/or associates of Kalkine Pty Ltd do not hold positions in any of the stocks covered on the website. These stocks can change any time and readers of the reports should not consider these stocks as personalised advice.
 Please wait processing your request...