Kalkine has a fully transformed New Avatar.

Company Overview: Vicinity Centres is an Australia-based retail property company. The principal activities of the Company includes property investment, property management, property development, leasing and funds management. It operates through two segment: Property Investment and Strategic Partnerships. Property Investment comprises net property income derived from investment in retail property. Strategic Partnerships includes fee income from providing property management, development and leasing services to third parties, and management of wholesale property funds. Its portfolio includes various shopping center types, such as super regional, major regional, city Centre, regional, outlet center, sub regional and neighborhood. The Company’s portfolio includes 62 shopping centers. It owns and operates shopping centers across various locations, including New South Wales, Queensland, South Australia, Tasmania, Victoria and Western Australia.
.png)
VCX Details
Q3FY19 Results Update - Well-Placed to Respond to Market Conditions: Vicinity Centres (ASX: VCX) is a mid-to-large cap Australia-based retail property company with the market capitalisation of ~$9.64 billion as on 16 May 2019. The company had recently released its quarterly report for the period ended March 2019 in which it witnessed specialty store and mini majors moving annual turnover (or MAT) growth of 3.3%. Specialty store MAT stood at $10,939 per sqm which reflects the rise of 10.3% on PCP basis, on the back of organic growth and the success of portfolio repositioning during the period. The destination portfolio speciality store MAT came in at $11,392 per sqm. Also, there has been progress with respect to value-accretive developments as the company stated that Hotel Chadstone is expected to open in November 2019 and it is taking bookings. With respect to The Glen, stage four of the major redevelopment happens to be on track to open in the month of August 2019.
The top management of the company had reflected favourable views with respect to the start to the calendar year and they added that their strategy for the new Vicinity has been in place for just more than 6 months. This strategy revolves around creating market-leading destinations, realising mixed-use opportunities across the portfolio, and expanding the wholesale funds platform. Further, the company stated that they are acquiring Vicinity securities on-market, they have wrapped up 4 solar projects and are continuing to work through the remaining asset sales and establishment of the proposed wholesale fund with higher-yielding Vicinity assets. Also, the company’s annual dividend yield stood at 6.33% which is higher than the industry median (Residential & Commercial REITs) of 5.5% reflecting that the company has been declaring decent amount of dividends as compared to the broader industry. However, the performance of retail market and structural changes with respect to the retail sector which includes online sales are the primary factors which might affect the performance of VCX moving forward. At CMP of A$2.57, VCX is trading at a PE multiple of 14.52x FY20E earnings. Fundamentally, the stock looks in a decent position with a net margin of 35.6% and ROE of 2.0% in 1HFY19. Over the last five years (FY14-FY18), the company’s revenues and net profit have grown at a CAGR of 15.1 percent and 32.6 percent, respectively. Keeping the view of growth potential in the long run at the back of decent financials, paying regular dividend to shareholders, accretive developments, and strategic initiatives amidst certain challenges, we have valued the stock using the two Relative valuation methods, P/E and EV/Sales and the five-year average EV/EBITDA multiple of 17.20x for FY20E with the consensus EBITDA of $878.70 and have arrived at the target price in the ambit of $2.59-$2.90 (lower double digit (%) upside) . Key Risks are - adverse performance in the retail sector, intense competition, macroeconomic variables such as interest rate, consumer behaviour, etc.
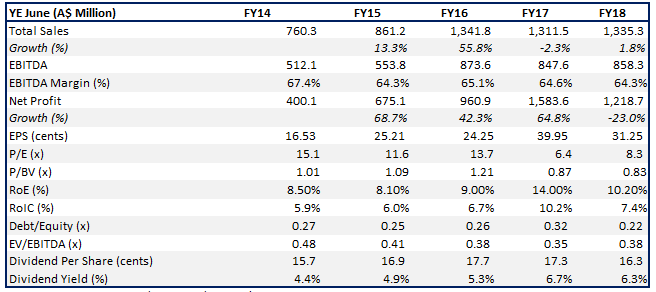
Key Financial Metrics (Source: Company Reports)
Top 10 Shareholders: The following table provides a broad overview of the top 10 shareholders in Vicinity Centres:
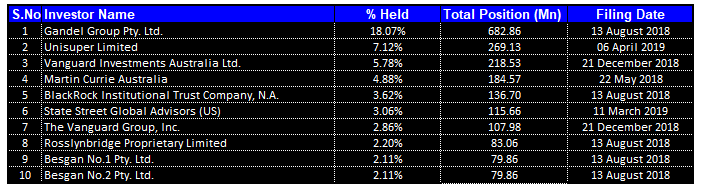
Top 10 Shareholders (Source: Thomson Reuters)
Decent Footing in Key Margins: Vicinity is having decent footing with respect to its key margins as its net margin stood at 91.3% in FY18 which is in line with the industry median of 91.3%, reflecting that the company’s capability to convert its top line into bottom line is matching up with the broader industry. The company’s gross margins stood at 74.3% which is higher than the industry median of 71.8% which implies that the company is in the better position to meet its operating expenses as compared to the industry. However, in 1H FY 2019, its net margins stood at 35.6% while its EBITDA margin stood at 61.4%.
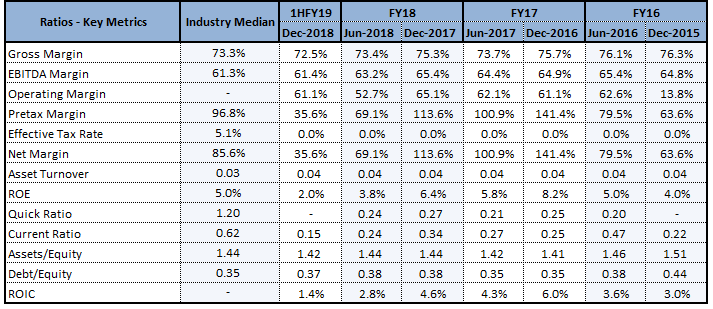
Key Metrics (Source: Thomson Reuters)
In 1H FY 2019, the company’s asset turnover ratio stood at 0.04x which is slightly higher than the industry median of 0.03x. During the same period, its Assets/Equity ratio stood at 1.42x which is lower than the industry median of 1.44x and, at the same time, it reflects a fall of 1.1% on YoY basis and it can be said that the company’s assets are largely being funded by equity and it has lesser reliance on debt. Also, its Debt/Equity ratio stood at 0.37x which implies a fall of 3.9% on the YoY basis reflecting that the company is largely focusing towards deleveraging its balance sheet.
A Look at VCX’s Portfolio Sales: Vicinity Centres stated that the Specialties and mini majors have been performing well and is helped by jewellery, retail services and leisure. The company had also stated that wages growth is out-pacing the living costs growth, exchange rate is leading growth in the inbound tourism to Australia, there happens to be low unemployment and there is strong and stable growth in population and strong Chinese tourism has been supporting VCX, particularly luxury retail. The following chart would give a broad overview:
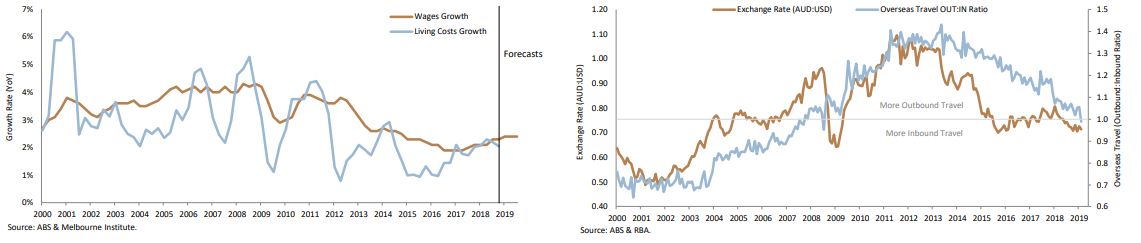
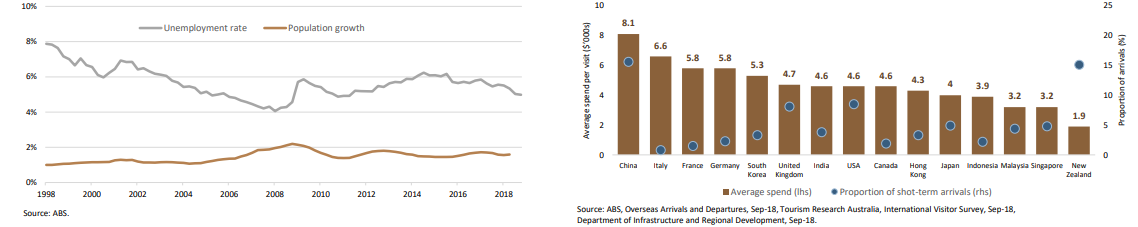
Metrics Related to Retail Environment (Source: Company Reports)
Vicinity stated that its Destination portfolio has been performing strongly and Specialty MAT per sqm of Destination portfolio stood at $11,392. The top management of the company had stated that even though the retail environment has been evolving, Vicinity happens to be well placed in order to respond to the changing market conditions and its strength is supported by the points of differentiation.
Chairman Plans to Retire from the Board: Vicinity Centres had made an announcement that the Chairman named Mr. Peter Hay intends to retire from the Board on August 14, 2019, following VCX’s FY19 annual results being released. He has served as the Chairman of the company since inception in the month of June 2015 and would be succeeded by the current Non-executive Director named Mr. Peter Kahan.
The release also stated that Mr. Peter has an extensive and successful property funds management, financial and business background, complemented by the highly strategic approach as well as vision, makes him to be a correct fit as Chairman through the company’s next chapter.
Stability in Net Tangible Assets at End of December 2018: The statutory net profit of Vicinity Centres for six months ended December 31, 2018 stood at $235.3 million as compared to $755.9 million in six months to December 31, 2017. The decrease was mainly because of non-cash revaluation decrements on the directly owned properties as well as net foreign exchange movements with respect to interest-bearing liabilities. The Funds from operations (or FFO) amounted to 9.06 cents per security reflecting a fall of 0.9% because of the impact of divestment of 16 higher yielding, non-core assets over the past 18 months. However, on a comparable basis, the company’s FFO per security witnessed a rise of 2.0%.
However, the company’s net tangible assets were relatively stable and stood at $2.96 per security as compared to $2.97 as at June 30, 2018.
VCX Possesses Robust Balance Sheet: Vicinity Group is having a robust balance sheet and it has a diverse range of funding sources. The company established or extended $1.5 billion of debt facilities during the six months ended December 2018 and FY19 and FY20 expiries have been reduced and debt duration had been maintained at greater than 4 years. The company stated that asset sales to date had reduced the gearing to 25.1% at 31 December 2018 which is at lower end of the 25%-35% target range. This, coupled with VCX’s investment grade credit ratings, reflects that it has robust balance sheet for substantial reinvestment into retail development pipeline as well as other value-accretive opportunities.
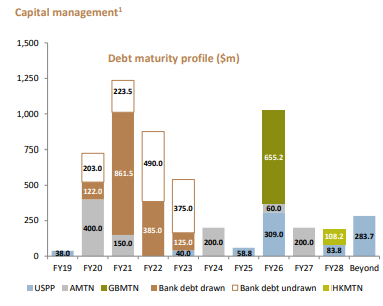
Capital Management (Source: Company Reports)
Buy Back Update: With respect to buy-back and as per the release dated May 7, 2019, the company has bought back total 186,819,434 shares and total consideration involved in doing so stood at $486,282,559. Moreover, the company plans to buy-back up to 93,802,683 stapled securities.
Respectable Payout Ratio Might Attract Market Players’ Attention: In 1H FY 2019, Vicinity Group made an announcement of distribution per security amounting to 7.95 cents which demonstrates FFO payout ratio of 87.2% and adjusted FFO (or AFFO) payout ratio of 95.2%. Additionally, there are expectations that the company’s distribution payout ratio is anticipated to be at the upper end of target range of 95% to 100% of the adjusted FFO. The annual dividend yield of the company is about 5.5% on a five-year average basis (FY14-18). Currently, the annual dividend yield of the company happens to be at 6.33% which is higher than the industry median of 5.5%.
Also, there has been an improvement in the company’s cash from operating activities from FY 2014 to FY 2018 which further strengthens the confidence in the company’s operational capabilities. As a result, there are expectations that the company’s strong operational capabilities might help it achieving the long-term growth prospects.
.PNG)
Key Valuation Metrics (Source: Thomson Reuters)
What To Expect From VCX: Vicinity stated that with completion of numerous retail projects in late 2018, the centre happens to be well positioned when it comes to future growth and is also looking to take the service and experience to the next level. The company added that planning continues on numerous additional opportunities in order to create value for the securityholders of Vicinity through development. There are expectations that funds from operations (or FFO) per security in FY 2019 would be in the range of 18.0 to 18.2 cents.
Also, the company possesses robust balance sheet which could help in witnessing growth moving forward and might also help in making deployments towards the strategic business objectives.
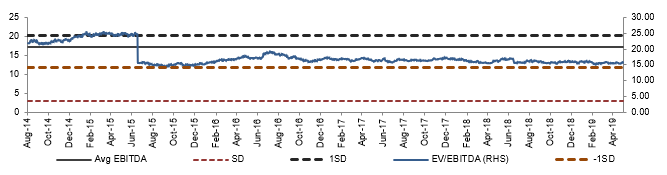
Historical EV/EBITDA Band (Source: Company Reports)
Stock Recommendation: The stock of Vicinity Centres has delivered the return of 0.39% over the span of previous one year while, in the time frame of past one month, the stock posted the return of 1.59%. The company stated that repositioning of the portfolio towards around 50 market-leading destinations is progressing, and strong operating metrics for this group of assets reflect that Vicinity's strategy would continue to unlock value and deliver sustainable growth for the securityholders. Further, the company stated that the retail environment has been evolving but it is well positioned when it comes to responding to the changing market conditions.
However, the company’s performance is sensitive to the performance of the retail market as well as structural changes with respect to the retail sector which includes online sales. Hence, looking at the growth potential in the business at the back of decent financials, paying regular dividend to shareholders, accretive developments, and strategic initiatives amidst certain challenges, we have valued the stock using the two Relative valuation methods, P/E and EV/Sales and the five-year average EV/EBITDA multiple of 17.20x for FY20E with the consensus EBITDA of $878.70 and have arrived at the target price in the ambit of $2.59-$2.90 (lower double digit (%) upside). Given the backdrop of aforesaid parameters, we recommend a “Buy” rating on the stock at the current market price of $2.570 per share (up 0.784% on 16 May 2019).
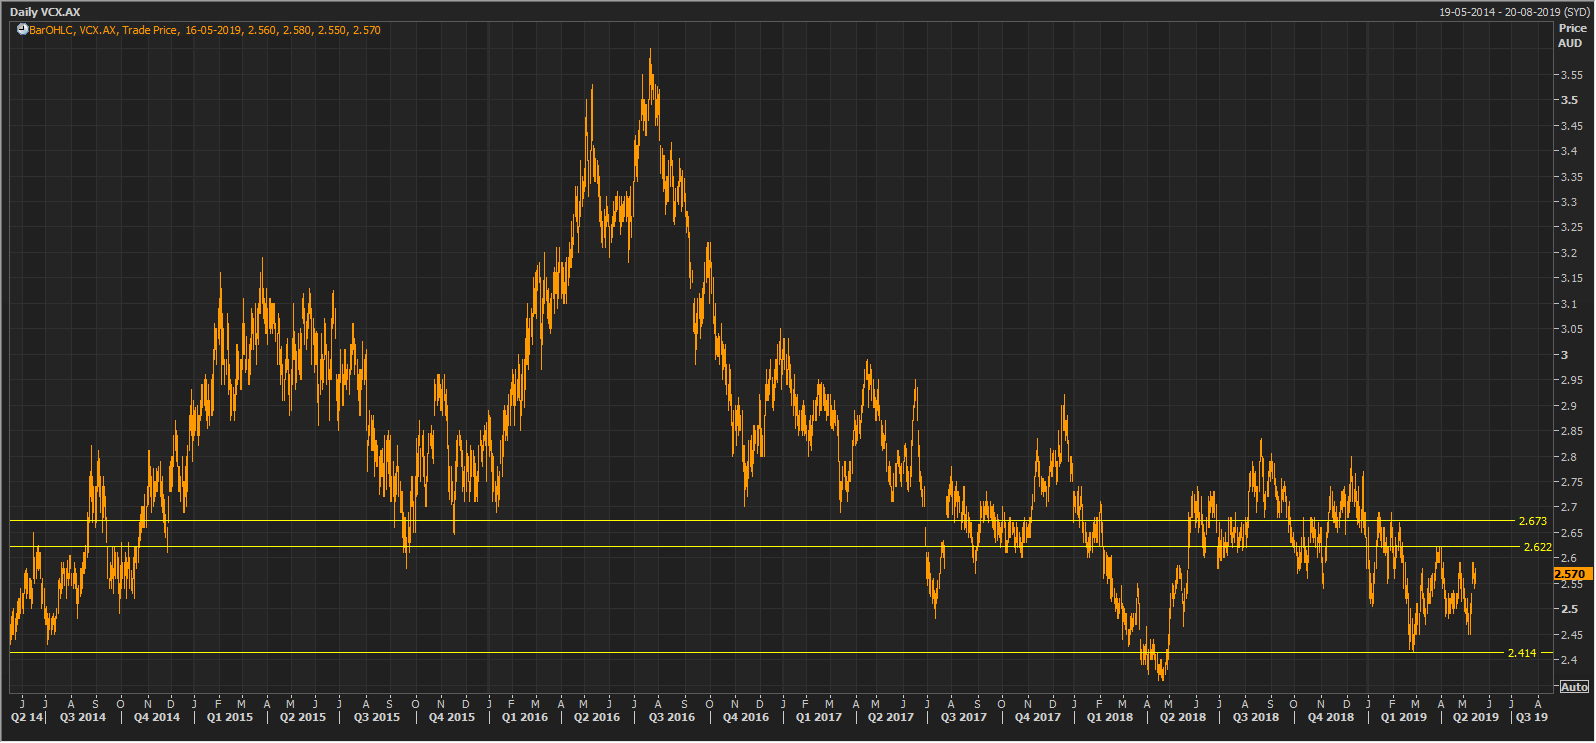
VCX Daily Chart (Source: Thomson Reuters)
Disclaimer
The advice given by Kalkine Pty Ltd and provided on this website is general information only and it does not take into account your investment objectives, financial situation or needs. You should therefore consider whether the advice is appropriate to your investment objectives, financial situation and needs before acting upon it. You should seek advice from a financial adviser, stockbroker or other professional (including taxation and legal advice) as necessary before acting on any advice. Not all investments are appropriate for all people. Kalkine.com.au and associated pages are published by Kalkine Pty Ltd ABN 34 154 808 312 (Australian Financial Services License Number 425376). The information on this website has been prepared from a wide variety of sources, which Kalkine Pty Ltd, to the best of its knowledge and belief, considers accurate. You should make your own enquiries about any investments and we strongly suggest you seek advice before acting upon any recommendation. Kalkine Pty Ltd has made every effort to ensure the reliability of information contained in its newsletters and websites. All information represents our views at the date of publication and may change without notice. To the extent permitted by law, Kalkine Pty Ltd excludes all liability for any loss or damage arising from the use of this website and any information published (including any indirect or consequential loss, any data loss or data corruption). If the law prohibits this exclusion, Kalkine Pty Ltd hereby limits its liability, to the extent permitted by law to the resupply of services. There may be a product disclosure statement or other offer document for the securities and financial products we write about in Kalkine Reports. You should obtain a copy of the product disclosure statement or offer document before making any decision about whether to acquire the security or product. The link to our Terms & Conditions has been provided please go through them and also have a read of the Financial Services Guide. On the date of publishing this report (mentioned on the website), employees and/or associates of Kalkine Pty Ltd do not hold positions in any of the stocks covered on the website. These stocks can change any time and readers of the reports should not consider these stocks as personalised advice.
 Please wait processing your request...