
Company Overview: Verizon Communications Inc. (NYSE: VZ), one of the largest players in the telecommunications equipment industry, was incorporated in 1983 in Delaware and was formerly known as Bell Atlantic Corporation (Bell Atlantic). Following its merger with GTE Corporation, the company started doing business as Verizon Communications Inc. on June 30, 2000. VZ is a holding company and offers products and services through its subsidiaries with a highly diverse workforce of ~135,000 employees as of December 31, 2019. In late 2018, a strategic reorganization of the business was announced by the company and with this new structure, w.e.f. 01 April 2019, VZ manages the business through two reportable segments – (a) Verizon Consumer Group, and (b) Verizon Business Group.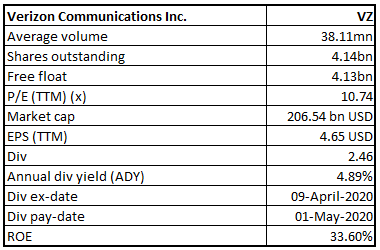
VZ Details
A Customer-centric Business Model, positioned for Accelerating Growth: Verizon Communications Inc. (NYSE: VZ) is one of the world’s leading global communications technology companies known for providing communications, information and entertainment products and services to end-users. VZ is a holding company and offers voice, data and video services and solutions on its networks through its subsidiaries. These products and services are developed to match the end-user’s demand for mobility, reliable network connectivity, security and control. The company is consistently deploying new network architecture and technologies to extend its leadership in both 4G (fourth-generation) and 5G (fifth-generation) wireless networks. The company achieved some important milestones in 2019 in terms of progress toward a fully operational and transformational 5G network. In April 2019, VZ became the first company in the world to give customers a 5G-enabled smartphone linked to a 5G network, and the number of cities receiving Verizon 5G reached 31 by year-end.
The year gone by brought innovation in 5G for Verizon and the company created a new operating structure while producing decent financial results. In FY19, the company leveraged on its network leadership, maintained and built a high-quality customer base, balanced profitability while focusing on business growth. FY19 was also characterized by the highest total wireless phone net addition since 2013 and the highest wireless service revenue growth since 2014. The period also saw a solid yoy adjusted EPS growth and the highest cash flow from operations since 2015. If we look at the past few years’ profitability, net income of the company has grown at a CAGR of 13.6% over the period FY16-FY19.
While 2019 transformation for VZ has created a strong platform for future strategy, the company intends to strengthen and grow core business, leverage assets to drive new growth, drive financial discipline and strength in balance sheet, and infuse a purpose-driven and customer-centric culture in 2020. The company expects the momentum to be continued in 2020 as VZ’s 5G footprint is likely to lead this phase of a transformational shift by creating these next-generation networks in the right manner.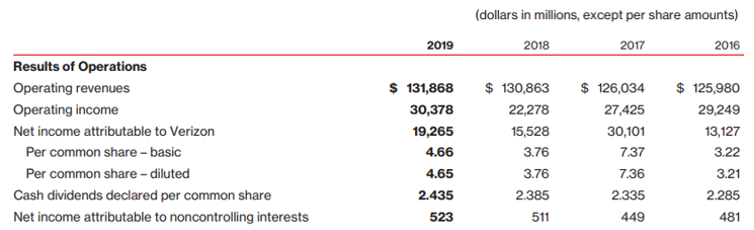
Key Financial Highlights over 2016-2019 (Source: Company Reports)
A Glimpse of FY19 Performance: Top-line of the company grew by 0.8% to $131.9 billion in FY19, including a 3.1% decline in wireless equipment revenue. Adjusted EBITDA for the year came in at $47.2 billion with adjusted EBITDA margin of 35.8%, a tad below the FY18 margin of 36.2%. FY19 adjusted EBITDA was impacted by headwinds of ~70 bps from the deferral of commission expense and the lease accounting standard, which slightly offset the VZ’s growth in FY19 on the operational front. FY19 adjusted EPS at $4.81 saw a growth of 2.1%, reflecting decent underlying performance, partially offset by commission expense deferral and ASC 842 Lease Standard.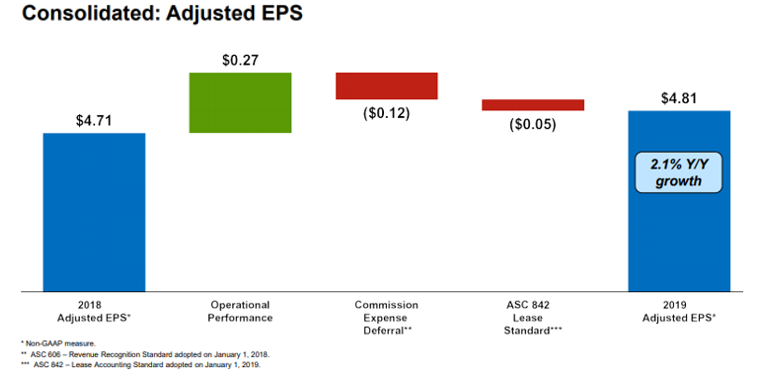
Adjusted Earnings Per Share (Source: Company Reports)
Cash flow from operations at the end of FY19 came in at $35.7 billion, up from $34.3 billion in FY18, owing to the operational improvements and a decline in discretionary employee benefit contributions, partially offset by increased cash tax paid and cash payments with regards to the Voluntary Separation Program. Capital expenditure at $17.9 billion in FY19 was slightly higher than FY18 capex of $16.6 billion and continued to support the launch and build-out of VZ’s 5G Ultra Wideband network and on other fronts.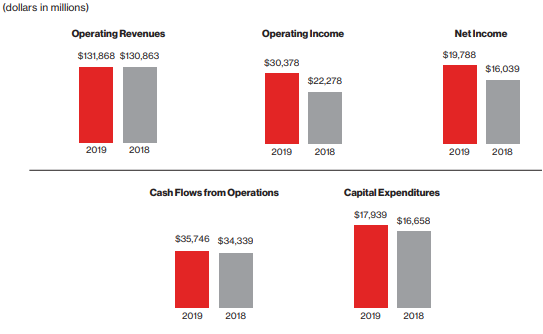
Key Financials 2019 and 2018 (Source: Company Reports)
Coming to the leverage position, unsecured debt on the balance sheet saw a decline of $3.9 billion in FY19. The company intends to reduce its net unsecured debt portfolio and bring it in the range of 1.75x - 2.0x, while actively managing its near-term maturities and optimizing its overall funding footprint.
With its Business Excellence program, the company has gained cumulative cash savings amounting to $5.7 billion and is well-positioned to accomplish the goal of $10 billion of cumulative cash savings by FY21. The Voluntary Separation Program resulted in ~$1.3 billion of expense savings in FY19.
Segment-wise performance: Under its new reporting structure, Verizon 2.0, there are two reportable segments that the company operates and manages as strategic business units- Consumer and Business.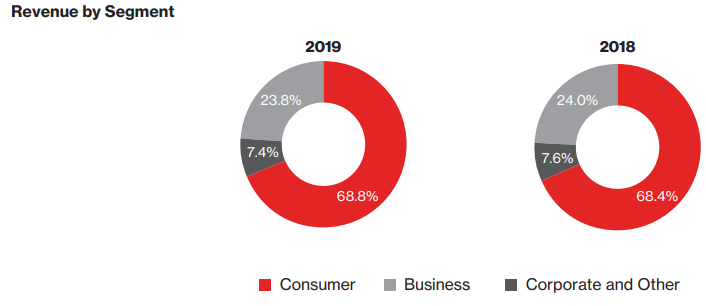
Revenue Break-up (Source: Company Reports)
Verizon Consumer Group- The segment in FY19 saw a revenue of $91.1 billion, reflecting a growth of 1.4% as compared to FY19. At the end of FY19, Consumer had ~95 million wireless retail connections, 6 million broadband connections and 4 million Fios video connections.
Verizon Business Group- Operating revenue for the segment in FY19 came in at $31.4 billion, posting a yoy decline of 0.3%. The business at the end of FY19 experienced ~25 million wireless retail postpaid connections and 489 thousand broadband connections.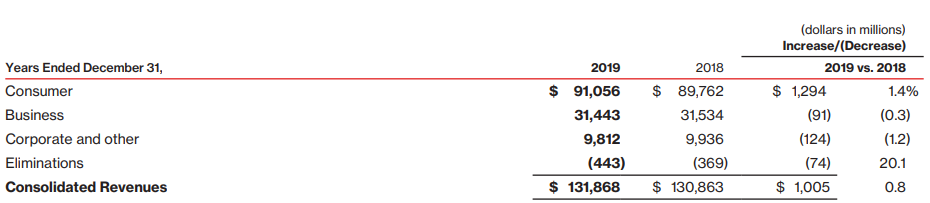
Segment-wise Revenue (Source: Company Reports)
Strong Track Record of Awarding Investors through Dividend: The company has used its cash flows to maintain and grow the dividend payout to shareholders. During FY19, the Management increased the quarterly dividend payment by 2.1% to $0.6150 from $0.6025 per share from the previous corresponding quarter, making this the thirteenth consecutive year in which the company has raised dividend.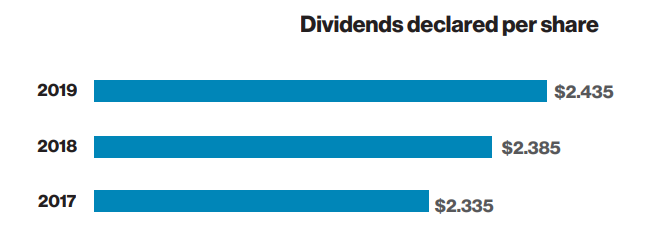
Dividend During 2017-2019 (Source: Company Reports)
Verizon 2.0 Strategy: In order to ensure that the market fully appreciates both the transformative potential of 5G and VZ’s unique capacity for delivering on that potential, the company has reshaped itself through Verizon 2.0 Strategy to address the needs, expectations, and requirements of current and potential customers. This Verizon 2.0 Strategy has three imperatives – (1) to preserve the immense advantages of having a highly skilled workforce; a deeply trusted brand; and a network infrastructure that is second to none. (2) to strengthen these core assets in order to retain market leadership at a time of increased competition. (3) to transform the operations wherever needed in order to not only keep pace with change, but to drive the change.
Top 10 Shareholders: The top 10 shareholders have been highlighted in the table, which together forms around 11.63% of the total shareholding. Vanguard Total Stock Market Index Fund and Vanguard 500 Index Fund hold the maximum interests in the company at 2.87% and 2.03%, respectively.
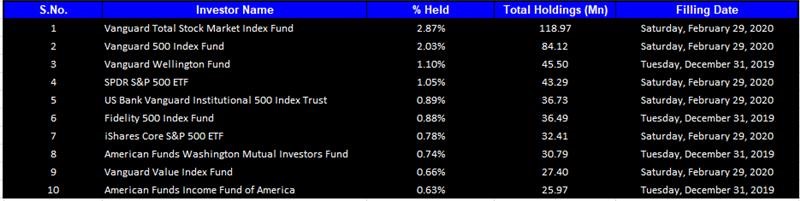
Top 10 Shareholders (Source: Thomson Reuters)
Key Metrics: The company has witnessed a decent financial ratios metrics with FY19 Gross, EBITDA and Operating margins at 58.5%, 36.0% and 20.2% remaining above the industry medians at 58%, 33% and 7.40% respectively. FY19 net margin improved further to 15% from 12.3% in FY18. FY19 return on equity came in at 33.6%, significantly above the industry median of 6.4%.
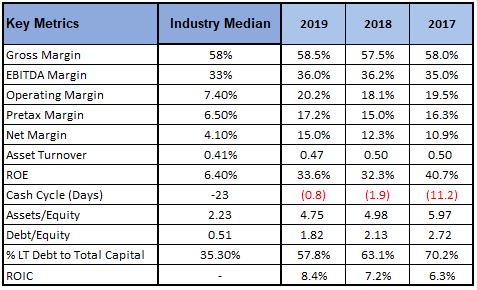
Key Metrics (Source: Thomson Reuters)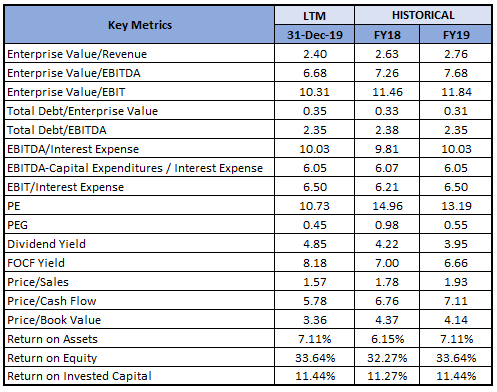
Key Valuation Metrics (Source: Thomson Reuters)
FY20 Outlook: Consolidated revenue for FY20 is likely to seelow-to-mid single-digit percentage growth. Momentum and growth in both Consumer and Business wireless service revenue is expected to be continued in FY20. Adjusted EPS in FY20 is likely to come in the range of 2%-4% on the back of strength in recurring revenues, investment in VBG to drive future performance, a relatively flat yoy depreciation & amortization, and slightly lower interest expenses than FY19. Adjusted effective tax rate for FY20 is targeted at 23% - 25%. The company will continue the expansion of 5G deployment while maintaining 4G network leadership with projected capital expenditure in the range of $17 billion – $18 billion in FY20.
Valuation Methodology: EV to EBITDA Multiple Based Relative Valuation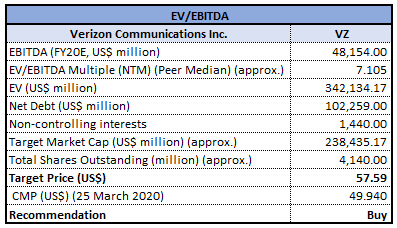
EV to EBITDA based Valuation (Source: Thomson Reuters)
Note: All forecasted figures and peers have been taken from Thomson Reuters, NTM-Next Twelve Months
Stock Recommendation: The stock of VZ closed at $49.94 with a market capitalization of $206.5 billion. The stock made a 52-week low and high of $49.02 and $62.22 and is currently trading close to the lower end of its 52-week trading range. The company has a recognized history of paying dividends and at the current market price of $49.94, the stock has a decent dividend yield of 4.89%. The company recorded a decent set of numbers in FY19 with bottom-line seeing more of an improvement than sales. The company rolled out 5G services successfully in 2019 giving the extra mile to the company’s business. Bigger opportunities come in the path of progressing business as VZ’s 5G Ultra Wideband service is expected to expand its reach further after touching 31 U.S. markets in 2019. The operational and financial performances are likely to see continued momentum with an optimistic outlook and healthy guidance for FY20. The company recently informed that 1QFY20 results are scheduled to be announced on 24 April 2020. Considering the above factors, we have valued the stock using EV to EBITDA multiple based relative valuation method and arrived at a target price with an upside of lower double-digit (in % terms). For the purpose, we have taken peers like AT&T Inc (NASDAQ: T.), T-Mobile US Inc (NASDAQ: TMUS), Comcast Corp (NASDAQ: CMCSA), to name few. Hence, we recommend a “Buy” rating on the stock at the closing price of $49.94, down 0.1% on 25 March 2020.
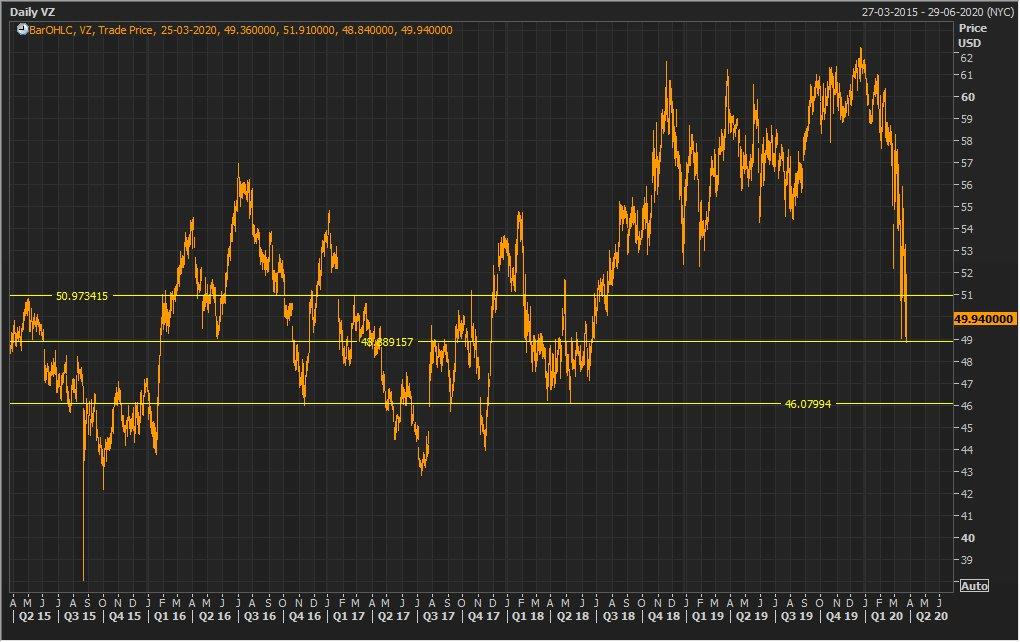
VZ Daily Technical Chart (Source: Thomson Reuters)
Disclaimer
The advice given by Kalkine Pty Ltd and provided on this website is general information only and it does not take into account your investment objectives, financial situation or needs. You should therefore consider whether the advice is appropriate to your investment objectives, financial situation and needs before acting upon it. You should seek advice from a financial adviser, stockbroker or other professional (including taxation and legal advice) as necessary before acting on any advice. Not all investments are appropriate for all people. Kalkine.com.au and associated pages are published by Kalkine Pty Ltd ABN 34 154 808 312 (Australian Financial Services License Number 425376). The information on this website has been prepared from a wide variety of sources, which Kalkine Pty Ltd, to the best of its knowledge and belief, considers accurate. You should make your own enquiries about any investments and we strongly suggest you seek advice before acting upon any recommendation. Kalkine Pty Ltd has made every effort to ensure the reliability of information contained in its newsletters and websites. All information represents our views at the date of publication and may change without notice. To the extent permitted by law, Kalkine Pty Ltd excludes all liability for any loss or damage arising from the use of this website and any information published (including any indirect or consequential loss, any data loss or data corruption). If the law prohibits this exclusion, Kalkine Pty Ltd hereby limits its liability, to the extent permitted by law to the resupply of services. There may be a product disclosure statement or other offer document for the securities and financial products we write about in Kalkine Reports. You should obtain a copy of the product disclosure statement or offer document before making any decision about whether to acquire the security or product. The link to our Terms & Conditions has been provided please go through them and also have a read of the Financial Services Guide. On the date of publishing this report (mentioned on the website), employees and/or associates of Kalkine Pty Ltd do not hold positions in any of the stocks covered on the website. These stocks can change any time and readers of the reports should not consider these stocks as personalised advice.
Past performance is not a reliable indicator of future performance.
 Please wait processing your request...