Kalkine’s Global Tariff Report provides fully independent analysis and data-driven analysis of major global sectors affected by tariff changes, evaluating the implications these shifts may have on equity valuations across those industries. The report concentrates on trade-sensitive sectors that typically experience heightened investor scrutiny during periods of tariff uncertainty. It also identifies defensive and countercyclical segments that demonstrate relative resilience or may even outperform, amid disruptions to global trade flows.
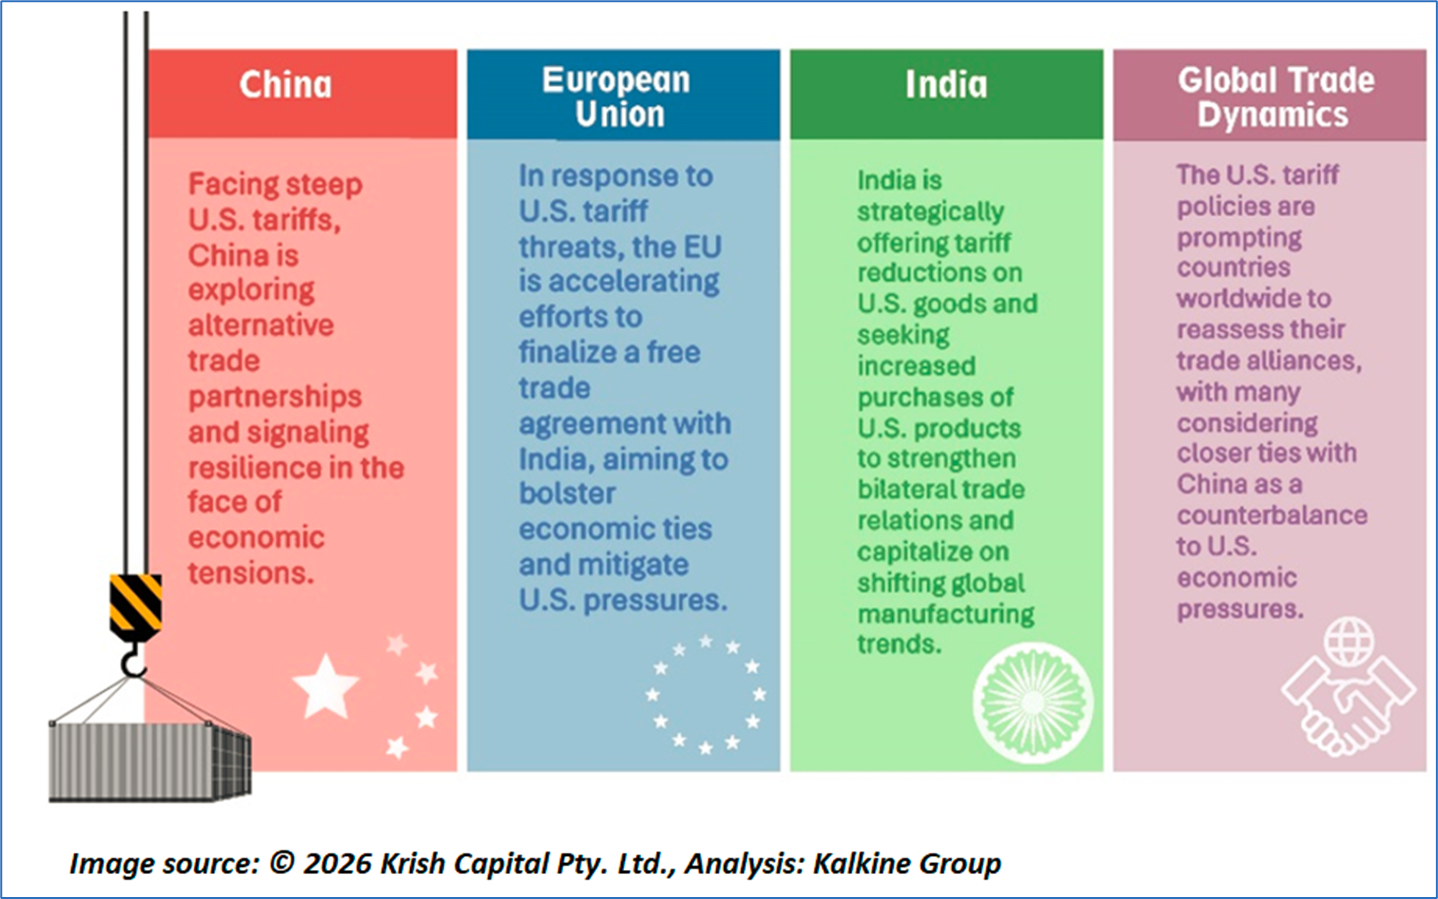
As illustrated in the table below, several key sectors in different countries are directly impacted by the recent tariff announcement from President Trump.

Latest Updates on Global Tariffs by Trump’s Administration
Key Developments
- U.S. Tariff Regime Transition: From Broad Escalation to Interim Stabilization: Following the U.S. Supreme Court tariff ruling February 2026, the United States has transitioned toward a temporary, broad-based tariff framework of approximately 10%, applicable for an interim period of roughly 150 days, effectively replacing previously invalidated country-specific reciprocal tariff measures. This policy shift is being complemented by the initiation of fresh trade investigations under alternative statutory provisions, reflecting a move toward a more rules-based yet still evolving tariff regime. Concurrent legal challenges from multiple U.S. states have introduced an additional layer of uncertainty, reinforcing the interim nature of the framework. While the immediate risk of broad-based tariff escalation has moderated, the policy trajectory remains fluid, with periodic volatility expected due to ongoing legal, political, and administrative developments.
- North America and India: Diverging Trade Dynamics and Strategic Realignments: From a regional perspective, the United States continues to maintain approximately 35% tariffs on non-compliant Canadian exports under the USMCA framework, while preserving tariff-free access for compliant trade flows, thereby sustaining stability across integrated supply chains such as autos and energy. Canada’s retaliatory tariff measures remain partially in force, particularly across metals and automotive sectors, despite selective rollbacks. In the case of India, U.S. tariffs on key export categories remain unchanged, and bilateral trade negotiations have decelerated amid renewed U.S. trade investigations; however, India has advanced diversification efforts, including progress toward a potential India-EU Free Trade Agreement, aimed at enhancing market access beyond the U.S. corridor.
- U.S.–China and U.S.–EU Relations: Stabilisation Without Structural Resolution: In relation to China, the U.S.–China tariff truce remains operational, maintaining reduced tariff intensity and temporary easing of certain non-tariff barriers, although the effective tariff burden continues to remain elevated in the ~25–30% range, thereby limiting substantive relief. While recent bilateral engagements have contributed to short-term stabilisation, no structural rollback of tariffs has been achieved, and ongoing U.S. investigations—particularly in strategic sectors such as semiconductors—continue to underpin medium-term uncertainty. Similarly, the U.S.–European Union trade framework currently caps most EU-origin exports at approximately 15% effective tariff levels, with the European Commission maintaining a suspension of retaliatory tariffs to support a de-escalatory environment. Nevertheless, incomplete legislative formalisation and unresolved sector-specific negotiations (notably in steel, aluminium, and semiconductors) indicate that targeted tariff risks persist.
- Global Trade Outlook: Managed Stability Amid Persistent Structural Uncertainty: Overall, the global trade environment has transitioned from a phase of broad-based escalation to one of managed stability, albeit without full normalisation. While systemic tariff risks have eased, sector-specific measures, legal uncertainties, and geopolitical signalling continue to drive episodic volatility. Consequently, global trade flows are increasingly shaped by diversification strategies—particularly among economies such as India and the European Union—and by the gradual evolution toward more structured, rule-based trade frameworks.
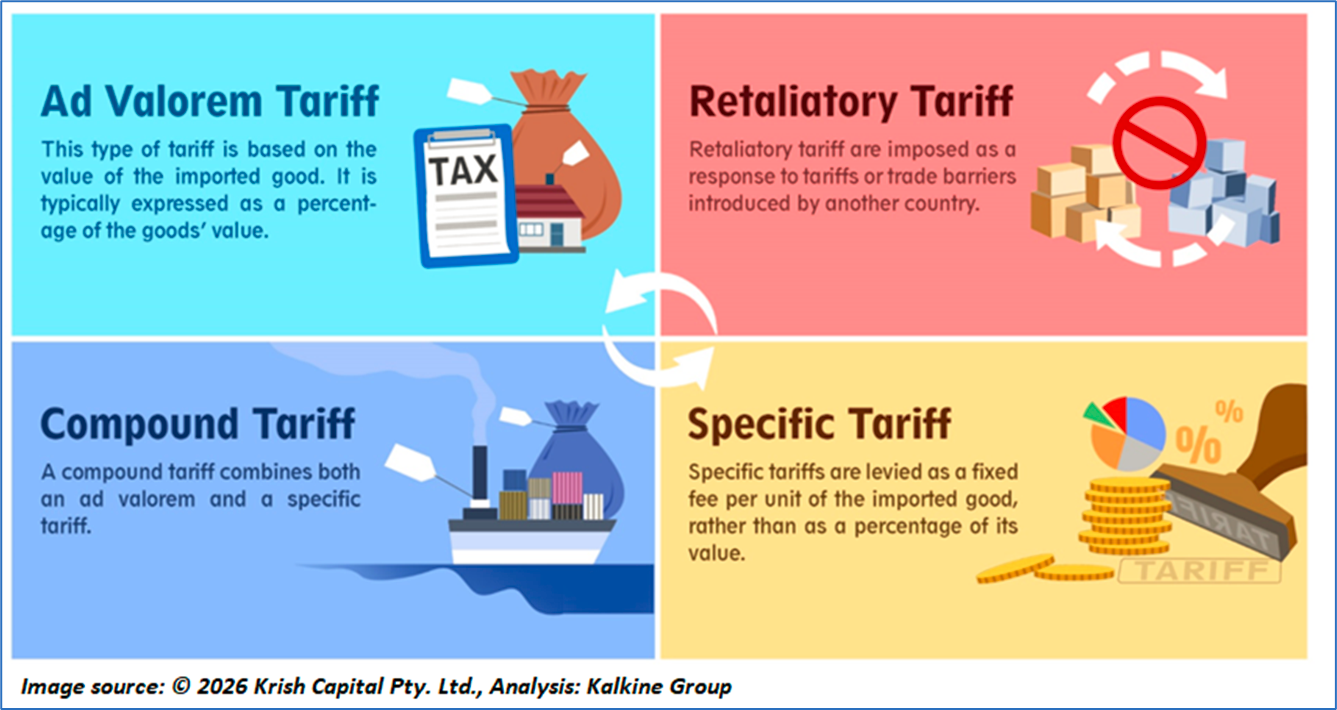
What are the different types of Tariffs?
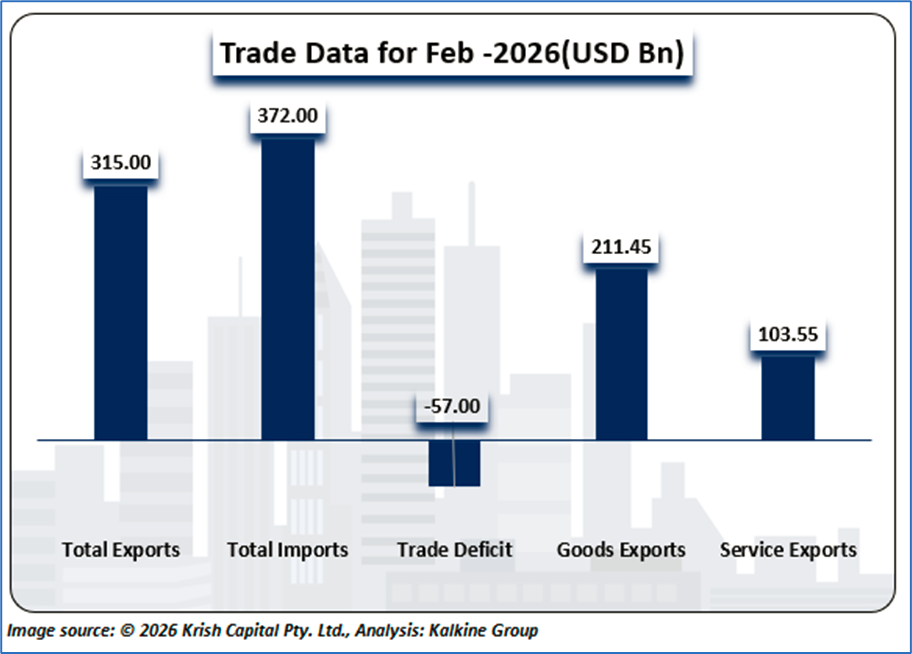
A Snapshot of USA’s Trade Size
The U.S. trade data for February 2026 indicates a continued imbalance in external trade, with total imports of approximately USD 372 billion significantly exceeding exports of around USD 315 billion, resulting in a trade deficit of about USD 57 billion. While goods exports contributed roughly USD 211 billion, services exports remained a meaningful but smaller component at USD 103.6 billion, underscoring the structural reliance on goods trade for export revenues. The elevated import levels reflect strong domestic demand and consumption, but also highlight ongoing dependence on foreign supply chains. Meanwhile, the sizable deficit suggests persistent external sector pressure, although stable services exports provide partial support to the overall trade balance.
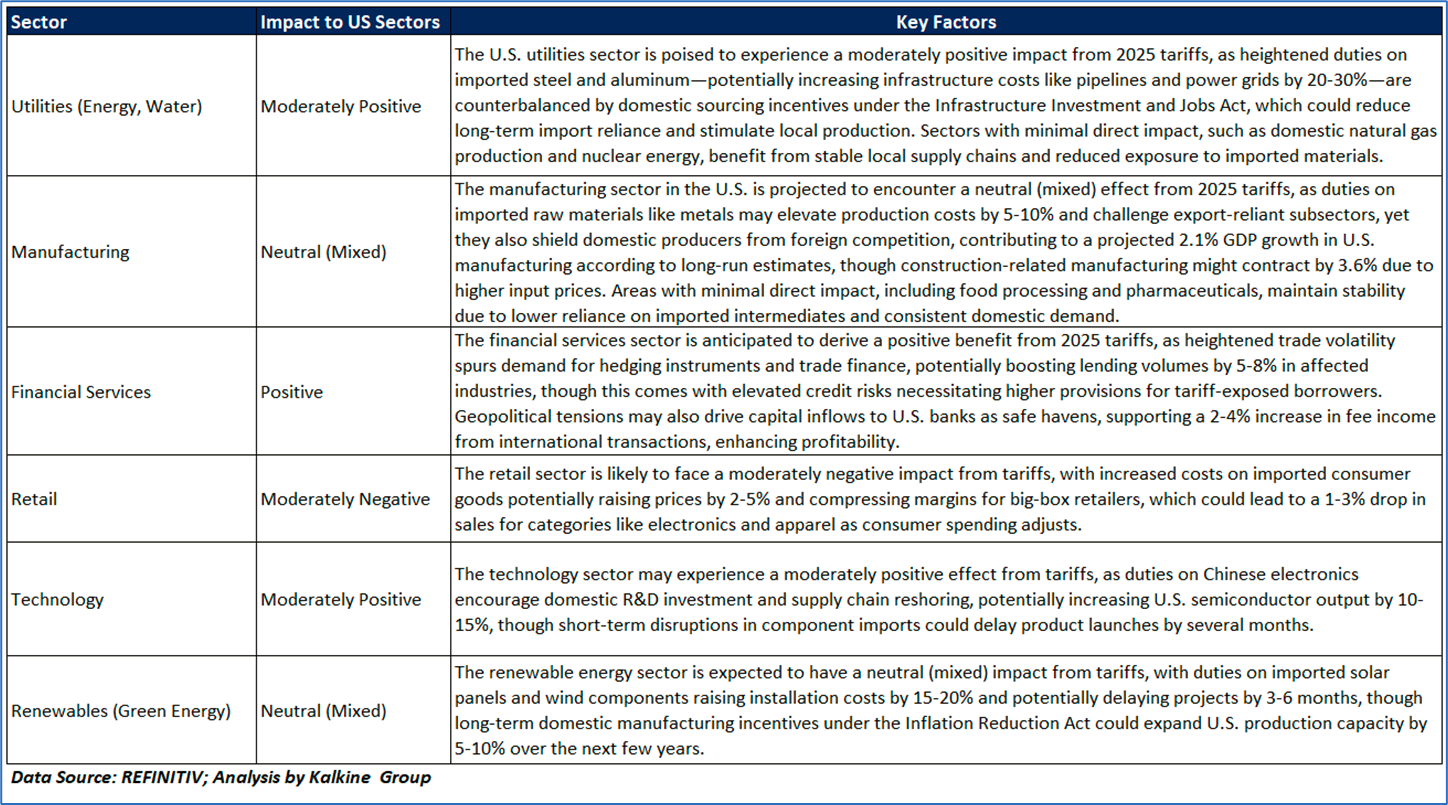
Impact of US Tariffs on Various Sectors
The U.S. economy is currently grappling with significant challenges, including high inflation, supply chain disruptions, and the effects of aggressive monetary policy from the Federal Reserve. Key sectors such as manufacturing, agriculture, and technology are feeling strain, particularly due to their dependence on global supply chains and export markets, with trade policies like tariffs on steel, aluminum, and electronics driving up costs for businesses and consumers alike. Despite these pressures, there’s cautious optimism in some quarters about market stabilization within the next year, though this is tempered by ongoing issues like labor shortages, energy price volatility, and political divisions. The Federal Reserve’s interest rate hikes aimed at curbing inflation still above target levels have slowed economic growth, raising recession risks, while strategic efforts such as trade agreements and supply chain diversification remain critical to fostering stability and mitigating prolonged uncertainty across these vital sectors.
Why do Uranium royalty and streaming industry Appear Attractive Despite Tariff Concerns?
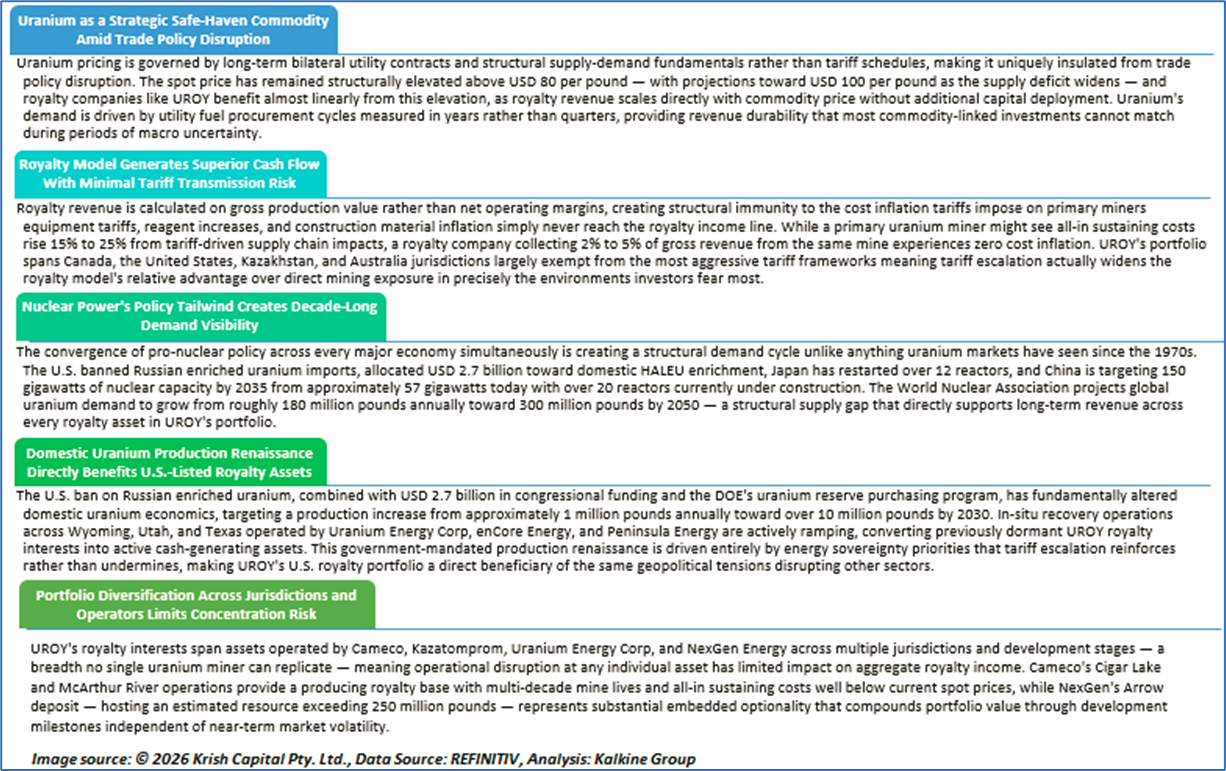
Amid elevated Market Volatility and Tariff pressures, Uranium Royalty Corporation (NASDAQ: UROY) stands out as our defensive pick within the Uranium royalty and streaming industry, supported by rigorous fundamental and technical research
Kalkine’s Global Tariff Report covers the Investment Highlights, Key Financial Metrics, Risks, Technical Analysis along with the Valuation, Target Price, and Recommendation on Uranium Royalty Corporation (NASDAQ: UROY).
Section 1: Company Overview and Fundamental Insights
1.1 Company Overview:
Uranium Royalty Corporation (NASDAQ: UROY) operates as an exploration company, which engages in acquiring and assembling a portfolio of royalties, and investing in companies with exposure to uranium and physical uranium. The company was founded by Amir Adnani on April 21, 2017 and is headquartered in Vancouver, Canada.
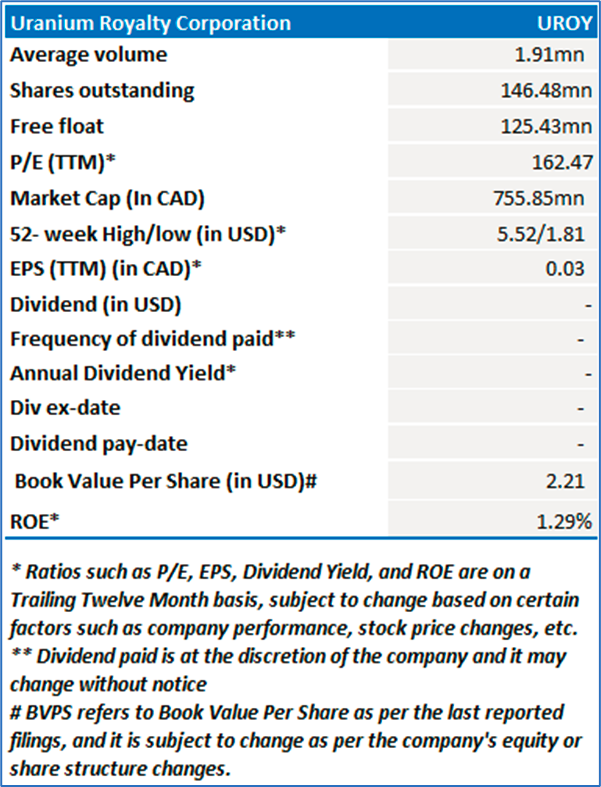
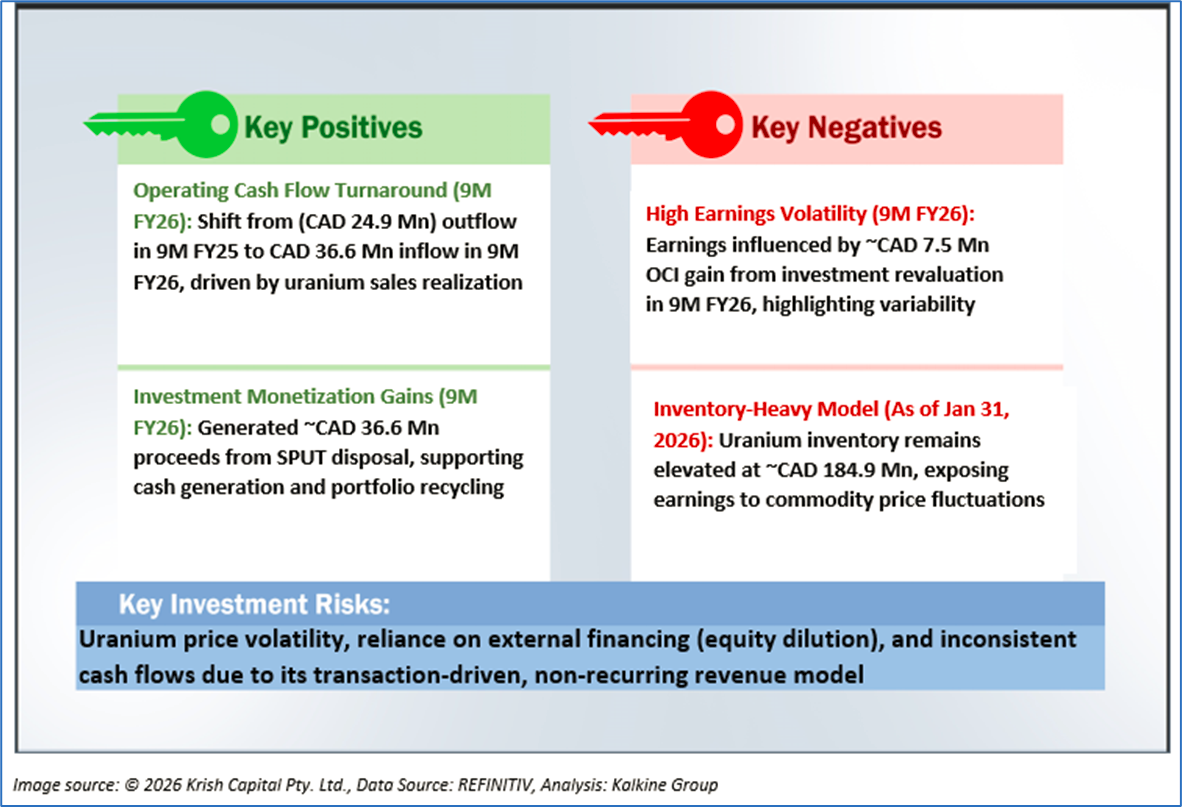
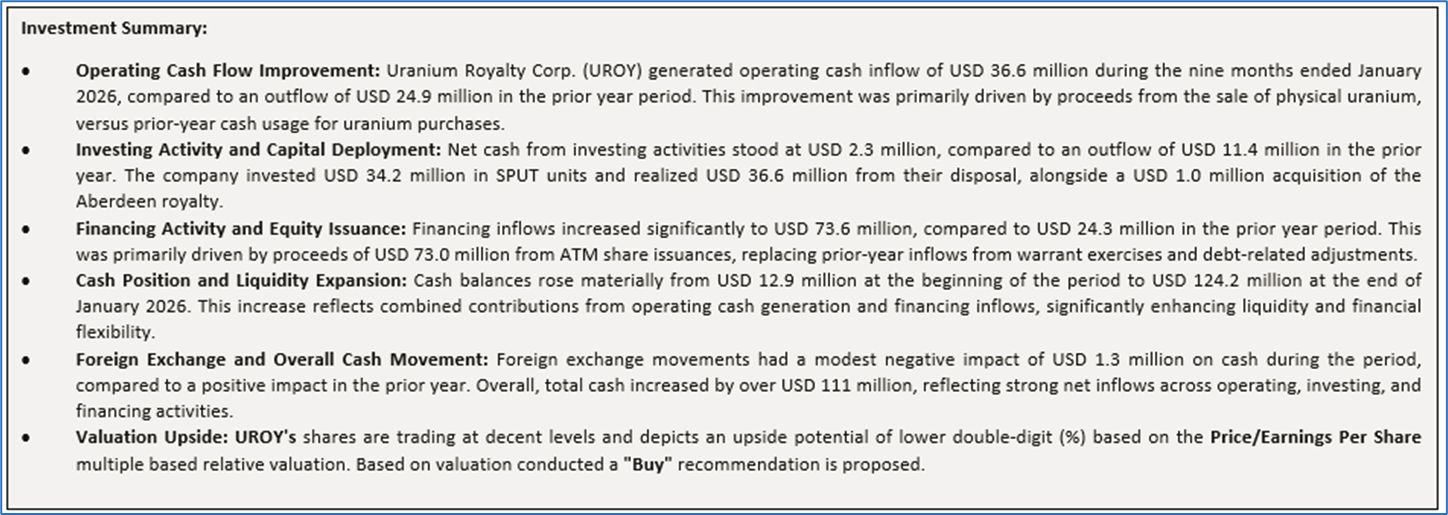
1.2 The Key Positives, Negatives, Investment Highlights and Risks
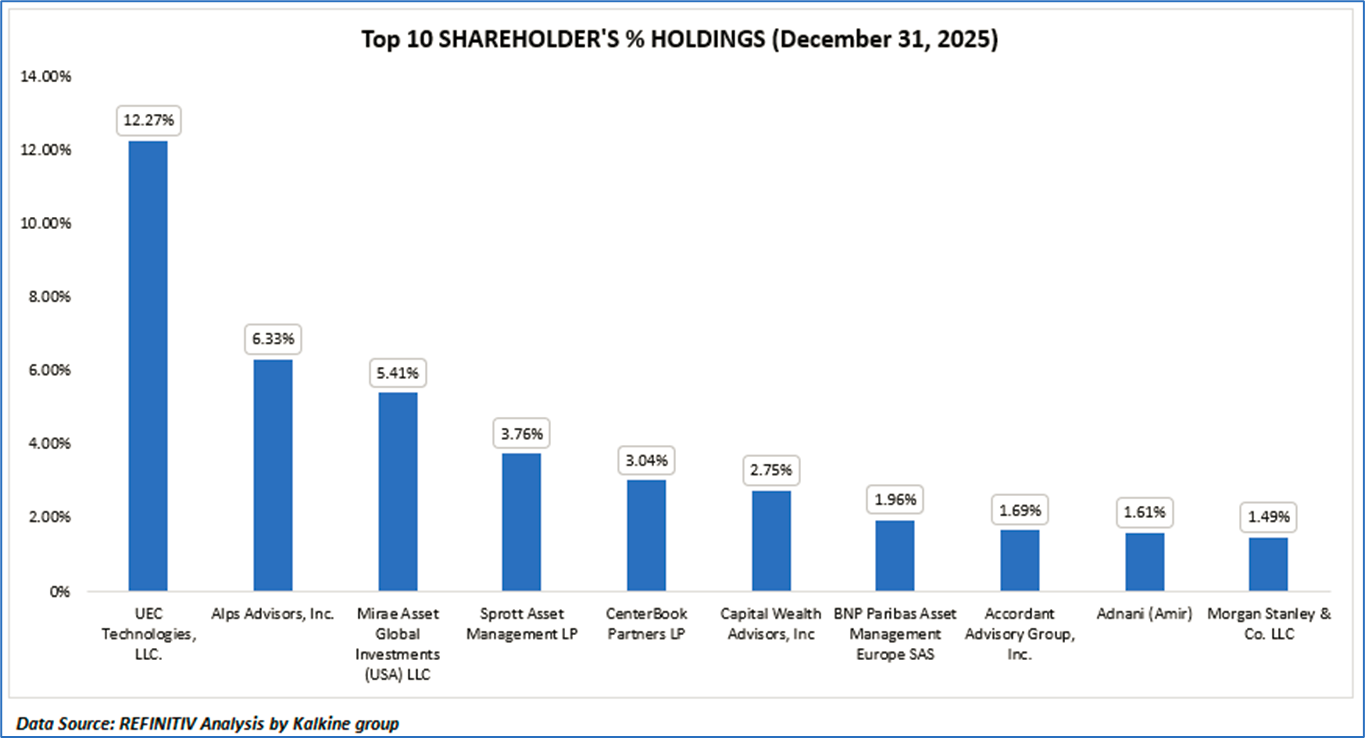
1.3 Top 10 Shareholders:
The top 10 shareholders together form ~40.32% of the total shareholding, indicating diverse holding. UEC Technologies LLC., and Alps Advisors, Inc. hold a maximum stake in the company at ~12.27% and ~6.33%, respectively.
Section 2: Business Updates and Financial Highlights
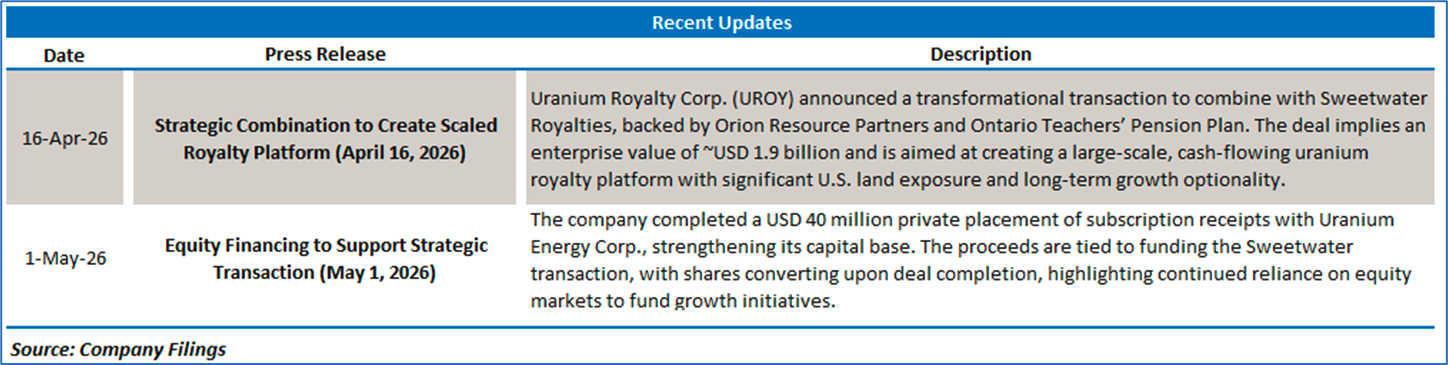
2.1 Recent Updates: The below picture gives an overview of the company’s update on its next reporting date.
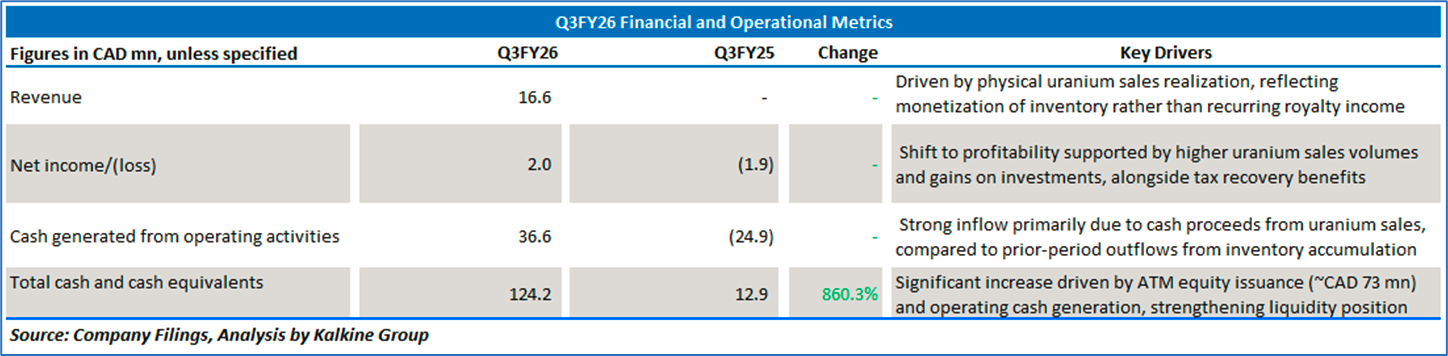
2.2 Insights into Q3FY26 Financial Performance:
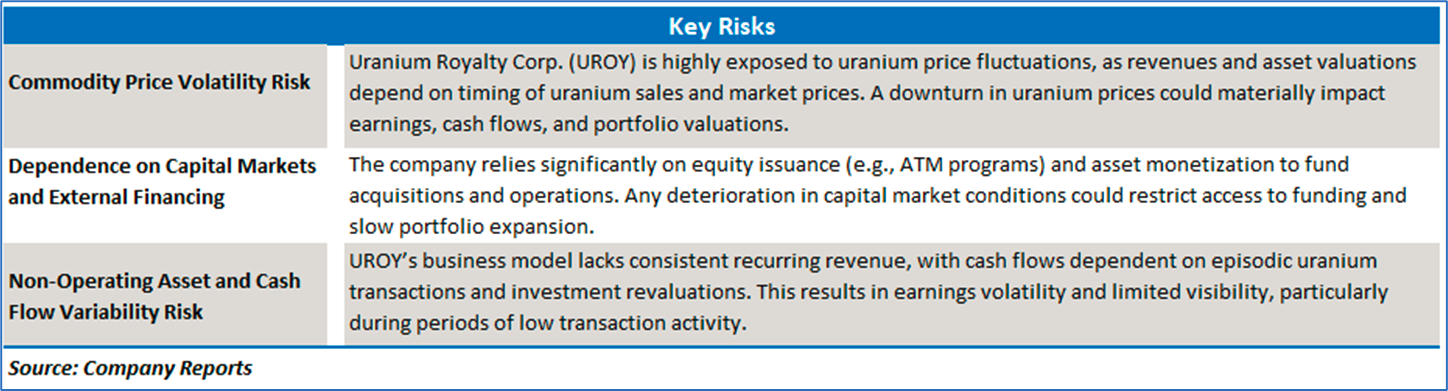
Section 3: Key Risks, Company Outlook:
Section 4: Stock Recommendation Summary:
4.1 Price Performance and Technical Summary:
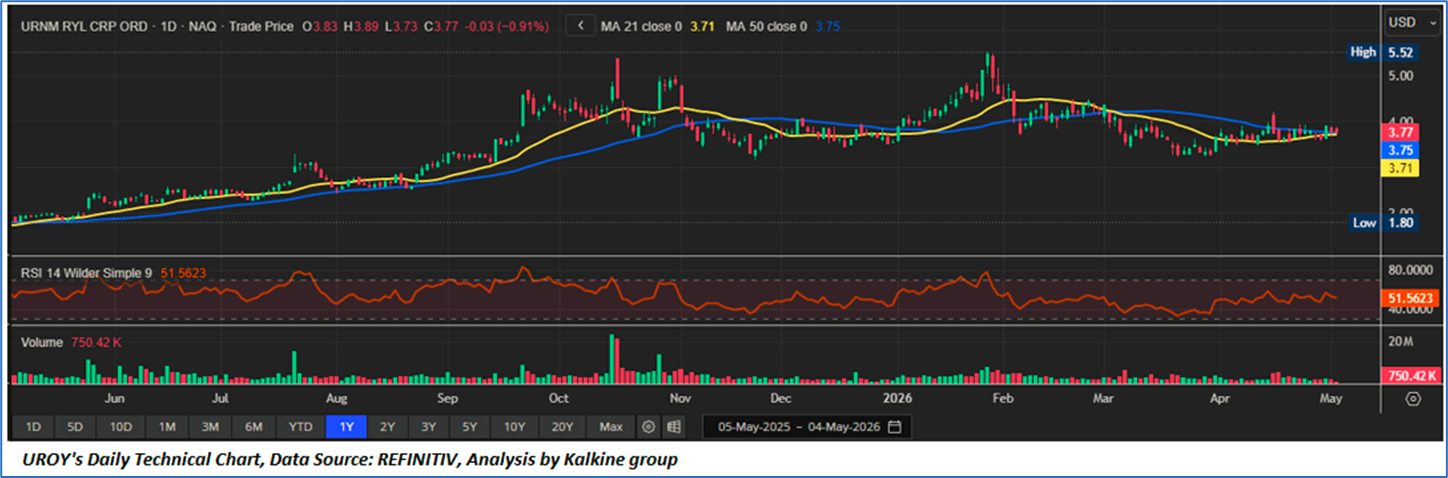
- Trend Structure and Moving Average Positioning: The price structure of Uranium Royalty Corp. (UROY) reflects a range-bound to mildly bearish consolidation phase, with price oscillating around the 21-day and 50-day moving averages (~USD 3.7–3.8 zone). The inability to sustain above key moving averages indicates lack of strong trend conviction, while repeated tests of these levels suggest equilibrium between buyers and sellers. Broader technical data also indicates that the stock is trading below several medium-term moving averages, reinforcing a neutral-to-bearish bias in the short term.
- Momentum Indicators and RSI Behaviour: Momentum remains neutral, with RSI hovering in the mid-range (~45–52), indicating neither overbought nor oversold conditions. This aligns with the observed sideways price action and lack of directional strength. Additionally, weak ADX readings suggest that the current trend lacks strength, while mixed oscillator signals (MACD slightly negative, stochastic neutral) point toward indecision rather than trend continuation.
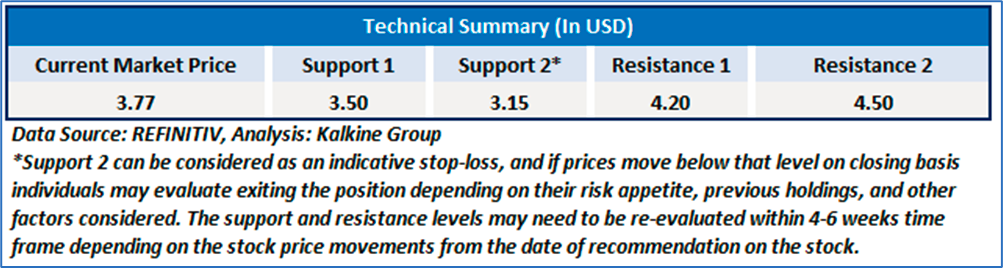
- Volume Profile and Breakout Probability: Volume trends remain relatively moderate, with occasional spikes during price swings but no sustained accumulation pattern. This indicates absence of strong institutional participation, limiting breakout sustainability. From a key levels perspective, immediate support is observed near USD 3.6–3.7, while resistance lies in the USD 3.9–4.0 range. A decisive move above resistance with volume confirmation could trigger a bullish breakout, whereas failure to hold support may lead to renewed downside pressure. Overall, the setup suggests a range-trading environment with breakout-dependent directional bias.
4.2 Fundamental Valuation
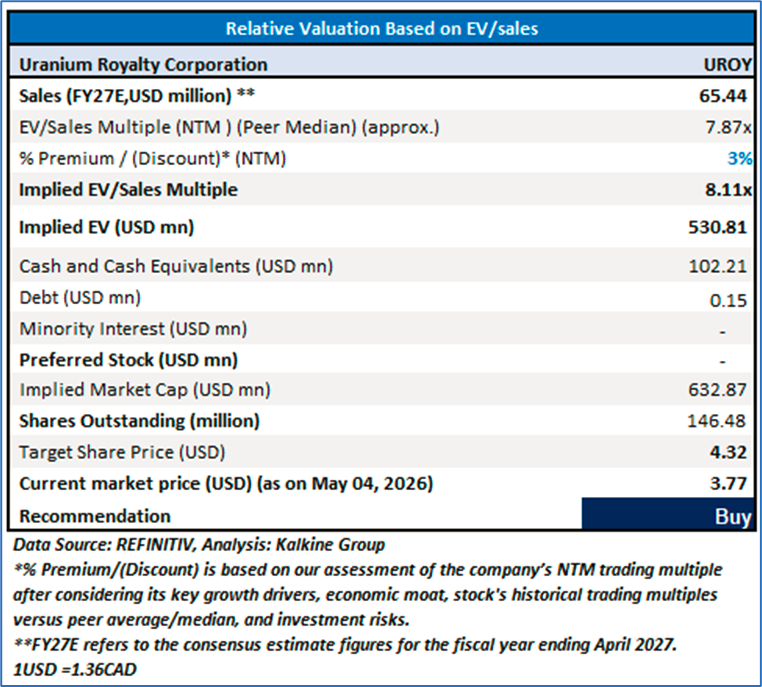
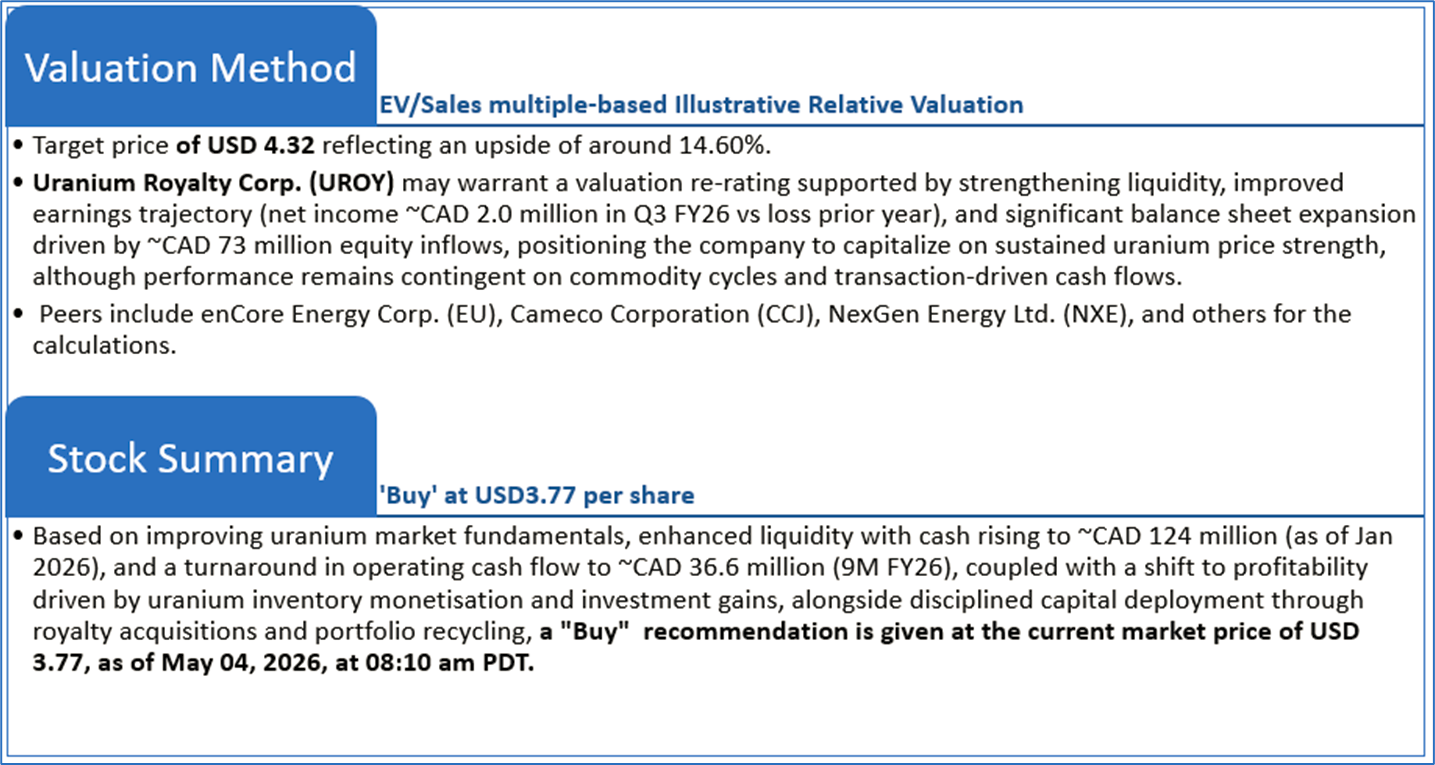
Valuation Methodology: EV/Sales Multiple Based Relative Valuation (Illustrative)
Note 1: Past performance is not a reliable indicator of future performance.
Note 2: The reference date for all price data, currency, technical indicators, support, and resistance levels as on May 04, 2026. The reference data in this report has been partly sourced from REFINITIV.
Note 3: Investment decisions should be made depending on an individual's appetite for upside potential, risks, holding duration, and any previous holdings. An 'Exit' from the stock can be considered if the Target Price mentioned as per the Valuation and or the technical levels provided has been achieved and is subject to the factors discussed above.
Note 4: Dividend Yield may vary as per the stock price movement.
Note 5: Kalkine reports are prepared based on the stock prices captured either from REFINITIV or Trading View. Typically, REFINITIV or Trading View may reflect stock prices with a delay which could be a lag of 25-30 minutes. There can be no assurance that future results or events will be consistent with the information provided in the report. The information is subject to change without any prior notice.
Technical Indicators Defined: -
Support: A level at which the stock prices tend to find support if they are falling, and a downtrend may take a pause backed by demand or buying interest.
Resistance: A level at which the stock prices tend to find resistance when they are rising, and the uptrend may take a pause due to profit booking or selling interest.
Stop-loss: In general, it is a level to protect further losses in case of any unfavorable movement in the stock prices.
Disclaimer-
This report (“Report”) has been issued by Kalkine Pty Limited (ABN 34 154 808 312) (Australian financial services licence number 425376) (“Kalkine”) and prepared by Kalkine and its related bodies corporate who are authorised to provide general financial product advice. Kalkine.com.au and its associated pages are published by Kalkine.
Any advice provided in this Report is general advice only and does not take into account your objectives, financial situation or needs. You should therefore consider whether the advice is appropriate for your objectives, financial situation and needs before acting upon it.
There may be a Product Disclosure Statement, Information Memorandum or other offer document (“Offer Document”) for the securities or other financial products referred in this Report. You should obtain a copy of the relevant Offer Document and consider it before making any decision about whether to acquire the security or financial product.
Kalkine strongly recommends that you seek advice from a financial adviser, stockbroker or other professional (including taxation and legal advice) before acting on any of the general advice in this Report or on the Kalkine website. Not all investments are appropriate for all people.
The information in this Report and on the Kalkine website has been prepared from a wide variety of sources, which Kalkine, to the best of its knowledge and belief, considers accurate. Kalkine has made every effort to ensure the reliability of the information contained in its reports (including this Report), newsletters and websites. All information represents our views at the date of publication and may change without notice.
The information in this Report does not constitute an offer to sell securities or other financial products or a solicitation of an offer to buy securities or other financial products. Our reports contain general recommendations to invest in securities and other financial products. Kalkine is not responsible for, and does not guarantee, the performance of, or returns on, any investments mentioned in this Report.
Kalkine does not issue, sell or deal in any financial products.
This Report may contain information on past performance of particular investments. Past performance is not a reliable indicator of future performance. Returns stated do not take into account transaction costs and taxes. To the extent permitted by law, and excluding any dishonesty or gross negligence by Kalkine, Kalkine disclaims and excludes all liability for any direct, indirect, implied, punitive, special, incidental or other consequential loss or damage arising from the use of or reliance on this Report, the Kalkine website and any information published on the Kalkine website without any warranties or representations by Kalkine to you. To the extent the law prohibits or limits this exclusion, Kalkine limits its liability to the resupply of services.
Please also read our Terms & Conditions and Financial Services Guide for further information. Employees and/or associates of Kalkine and its related entities may hold interests in the securities or other financial products covered in this Report or on the Kalkine website. Any such employees and associates are required to comply with certain, procedures and disclosures as required by law.
Kalkine Media Pty Ltd, an affiliate of Kalkine Pty Ltd, may have received, or be entitled to receive, financial consideration in connection with providing information about certain entity(s) covered on its website including entities covered in this Report.
Copyright 2026 Krish Capital Pty. Ltd. (ABN 61629651510). All Rights Reserved. No part of this report, or its content, may be reproduced in any form without our prior consent.
Past performance is not a reliable indicator of future performance.

 CA
 NZ
 UK
 US
 IND

 AU

 Please wait processing your request...