Kalkine has a fully transformed New Avatar.

.png)
Australia, being an export-driven country, the economic development was influenced by export prices of primary commodities such as iron ore, coal, LNG, rural commodities (beef, wheat, etc.). Change in the commodity prices has a direct correlation on cash flows and economic activity, and influence on the Australian dollar movement.
The Reserve Bank of Australia released the Index of Commodity Prices which captures the price movement of 21 products categorized in different buckets based on weights. The current base year is set to 2018/19 according to the average export values. The Index values are calculated based on export prices and spot prices provided by Bloomberg, the Australian Bureau of Statistics, and other sources.
The Index of Commodity Prices have increased by 8.6% in December 2020 over the preceding month (on a Special Drawing Rights basis). The increase was broad-based covering all product categories. The largest contributor was bulk commodities with a 12.2% increase in price movements (on export price based). Bulk commodities represent about 52.6% of the overall Index. Iron ore has a significant weight of 27.1% in bulk commodities, followed by metallurgical coal (with 16.0%) and thermal coal (with 9.5%). On a spot price basis, prices of bulk commodities moved up by about 22.0% in December 2020 over the prior month. Prices of base metals have increased by 5.2% in December 2020 over the prior month. The base metals have weight of 4.3% on the overall Commodity Price Index. Copper has significant weight in the Base Metals category. Rural commodity goods prices have increased mildly by 0.9% in December 2020 over the preceding month. It had weight of 10.5% on the overall index. Wool, wheat and lamb and mutton led the category.
Figure 1. Broad-based Price Movement in December 2020:

Source: Data from Reserve Bank of Australia, Chart Created by Kalkine Group
Update on Bulk Commodities - Coal: Demand for resources and energy commodity products has recovered in December 2020 after sharp supply cuts in June’20 and September’20 quarter across the globe for certain commodities following plant closures amidst COVID outbreak. Chinese restrictions resulted in shipment delays of coal and production cuts. Iron ore exports benefited from strong demand from China. Recovery in America, Japan, South Korea and Europe partly mitigated the ongoing supply concerns in Brazil for iron ore.
Coal exports stood at $54.6 billion in 2019-20 accounting for about 19.0% of total resources and energy exports as per the data from the Department of Industry, Science, Energy and Resources. Australia is the world’s largest exporter of metallurgical coal with exports of about $34.2 billion in 2019-20. Curb on imports by China eroded export volumes of metallurgical coal in Sep’20 quarter over the preceding quarter. Exports were also affected by lower offtake from Japan and South Korea. Prices of Hard Coking Coal (HCC) has been volatile in recent times to settle at US $125 a tonne in December 2020, down from US$ 179 a tonne in comparable period last year. Metallurgical coal exports are projected to decline to $22 billion in 2020-21 according to the Department of Industry, Science, Energy and Resources owing to production cut-backs and mine closures. Thermal coal exports suffered from the damage of a coal loader at the Port of Newcastle. Thermal coal exports fell 23.3% to $3.4 billion in Sep’20 quarter over the preceding quarter. Prices have been stabilised on the back of strong demand and supply concerns at major exporting countries.
Figure 2. Curb on Imports by China Impacted Australian Coal Exports:

Sources: Data from the Department of Industry, Science, Energy and Resources. Chart Created by Kalkine Group
Update on Base Metals – Copper: Base metal prices have recovered to pre-COVID-19 levels benefited from the rebound in economic activity in China. As industrial activity recovers, prices of base metals are likely to improve further. China accounted for about half of world’s copper consumption. Consumption is expected to exceed 13 million tonnes in 2020, up by 4% registered in last year. Copper exports dropped by 8.0% to $2,500 million in Sep’20 quarter (QoQ basis) due to mine closures and production cuts. Increased adaption of electrification of transport, use of renewables and low-carbon emissions technologies such as batteries and EV charging infrastructure are likely to drive worldwide copper consumption going forward. Start of Oz Minerals’ Carrapateena mine in South Australia and ramp-up of production at Round Oak Minerals’ Mt Colin mine in Queensland are likely to boost export volumes in 2020-21. Copper prices touched a 7-year high of US$7,000/tonne in early December 2020, owing to a sharp increase in consumption at China, a strong Chinese renminbi and a weak US dollar. Copper stocks recovered in September 2020 after falling since mid-year and have broadly remained stable since then. Copper prices are expected to slightly decline to US$6,070/tonne in 2020 on account of surplus capacity as consumption falls short of production.
Figure 3. Sharp Increase in Copper Price Following Surge in Chinese Consumption:

Sources: Data from Department of Industry, Science, Energy and Resources. Chart Created by Kalkine Group
Update on Rural Commodities: This is the first time in many years that the Australian agriculture sector experienced upward price movements, driven by falling demand rather than draught and cyclones which had been seen historically. The virus outbreak in China negatively affected the exports of seafoods in Australia. Transition from the food services sector to the retail sector is not viable for a number of export markets and specifically impacted the red meat sector. Meat exports to Indonesia was impacted by lack of access to wet markets for consumers. Some products which were previously targeted to food services have been diverted to the supermarket and retail stores resulting in price differentials and not fully met the demand volumes. Wool, cotton and wood products were affected by supply-chain bottlenecks, disruption in the construction sector and consumer delay in purchase of new cloths and durable goods. Exports of rural goods have improved by 6.3% in November 2020 to $3,586 million. But the sector is yet to show recovery to pre-COVID levels.

Source: Data from Reserve Bank of Australia, Chart Created by Kalkine Group
Performance of Selected Agricultural Commodities: Wheat prices are expected to increase by 11% to average US$245 per tonne in 2020-21 led by production shortages in some exporting countries. Wheat demand usually follows the inelasticity pattern and during pandemic. Wheat products showed increased demand from bread, pasta and other staples. Global demand for beef and veal has been resilient in 2020 during the pandemic. Herd rebuilding has increased domestic demand for cattle as a result of favourable seasonal conditions.
Figure 5. Annual Export Trend of Selected Agriculture Commodities:

Source: Data from Australian Bureau of Agricultural and Resource Economics and Sciences, Chart Created by Kalkine Group
Key Risks: The global trade for commodities is likely to be affected by risks emanating from the possibility of renewed outbreaks, government containment measures and effective rollout of vaccines. Trade tension between South Korea and Japan gained friction following the announcement by the South Korea government on re-opening of its WTO complaint against Japan. This risk may create supply disruptions and influence prices. Further, stimulus easing at China may pose downward shifts in the price of iron ore as China plays a dominating role in iron ore consumption. The recovery of metallurgical coal price of Australia is largely dependent on Chinese government policy. But the prices may stay low if the Chinese informal restrictions on Australian coal extends beyond the end of 2020 quarter and goes into 2021.
Figure 6. Key Risks Impacting Prices and Recovery:

Source: Chart Created by Kalkine Group
Outlook: As per the data from the Department of Industry, Science, Energy and Resources, metallurgical coal exports are forecasted to reach $22 billion in 2020-21, down by 35.3% from 2019-20 levels. However, exports are projected to rebound to $27 billion in 2021-22 as global steel production recovers further. Rapid growth in consumption is likely to lift copper prices to US$6,570/tonne in 2022. Copper exports are expected to increase by 3.0% in 2021-22 to reach at ~$11 billion. The average price of Australian cattle is projected to increase by 23% in 2020-21 due to restocking demand. Herd rebuilding is expected to continue to benefit from the likelihood of above-average pasture growth in 2021. Considering the key improvement and outlook, we figured out 4 stocks on ASX from coal, copper, beef and rural commodities products that are set to see the momentum from the development.
(1) Coronado Global Resources Inc. (Recommendation: Buy, Potential Upside: Low Double-Digit)
(M-cap: A$ 1.54 Billion, Annual Dividend Yield: 0%)

Reducing Capacity and Maintaining Costs: Coronado Global Resources Inc. (ASX: CRN) is a coal mining company. The company produces and develops metallurgical coal portfolios. Temporary suspension of mining operations at Curragh in January 2020 resulted in a decline in sales volume by 20.2% in H1 FY20 over pcp. Share of exports shrunk from 76.7% in H1 FY19 to 74.0% in H1 FY20. Its US facility remained idle in April and May 2020 as global demand for metallurgical coal was impacted by COVID-19. The company realized metallurgical pricing of US $97.3/tonne, down by 29.2% over H1 FY19 due to a decline in pricing and softer market conditions. The company reached an agreement with lenders for a waiver of compliance of certain financial covenants until February 2021. CRN suspended dividend distribution in the light of weak market conditions. It exited the quarter with a cash balance of US $15.0 million as of Sep’20. CRN raised US $180 million from new equity funding during the Sep’20 quarter. Its net debt significantly reduced from US $405 million as of June 2020 to US $273 million as of Sep’20. In October 2020, the company filed with SEC shelf registration to raise US $300 million.
In the recent quarter update, CRN posted a 27.0% increase in saleable volumes to 4.9 million tonnes as compared to June’20 quarter. Realisation stood at US $86.0/tonne, down by 6.1% compared to the prior quarter. Its year-to-date mining cost declined to US $56.0/ tonne, down from US $57.3 at the end of June 2020.
Outlook: CRN has implemented a number of initiatives including the sale of non-core assets to improve liquidity. It is reviewing operations at Curragh with a focus on lost production recovery. The company’s US facilities to operate with minimal capacity to fulfil the current demand trends. Its Greenbrier facility will likely remain idle until 2021. The company reduced its capex for FY20 by 40%. Its H1 FY20 capex of US $61.9 million is on target for a 40% reduction over the full-year.
CRN is keeping its plants under close watch, aligning capacities to meet demand trends. As per the data from the Department of Industry, Science, Energy and Resources, metallurgical coal exports are forecasted to decline by 35.3% in 2020-21. Nevertheless, CRN has adequate financial resources to ramp-up the capacities as steel production recovers worldwide. The official data mentioned that exports of metallurgical coal to rebound to $27 billion in 2021-22.

Valuation Methodology: EV/ EBITDA Multiple Based Relative Valuation (Illustrative)x

EV/ EBITDA Multiple Based Relative Valuation (Source: Refinitiv, Thomson Reuters)
Note: All forecasted figures and peers have been taken from Thomson Reuters, NTM-Next Twelve Months

A-VIX vs CRN (Source: Refinitiv, Thomson Reuters)
Stock Recommendation: The stock posted positive 3-month and 6-month returns of 27.37% and 23.96%, respectively. However, the stock has corrected 2.56% in last one month giving an accumulation opportunity. It is currently trading below to the average of 52-week high price of $2.251 and 52-week low price of $0.580. CRN has maintained overall costs with operating costs declining to US $56.0/ tonne in year-to-date Sep’20, down from US $57.3 at the end of June 2020. The company showed an uptick in saleable volumes in Sep’20 quarter. It had lowered net debt to US $273 million as of Sep’20, down from US $405 million as of June 2020. CRN is planning to raise an additional US $300 million with shelf registration filed with SEC. The stock performed well over the the market volatility index. We have valued the stock using the EV/ EBITDA multiple based illustrative relative valuation method and arrived at a target price of low double-digit upside (in percentage terms). For this purpose, we have taken peers such as BlueScope Steel Ltd. (ASX: BSL), Whitehaven Coal Ltd. (ASX: WHC), New Hope Corporation Ltd. (ASX: NHC), to name a few. Considering the decent performance in the interim Sep’20, lower debt levels, the current valuation and trading levels, we give a “Buy” recommendation on the stock at the current market price of $1.140 up by 1.785% on 11th January 2021.
(M-cap: A$ 644.25 Million, Annual Dividend Yield: 0%)

Improved Realization and Strong Cash: Cooper Energy Ltd. (ASX: COE) is an oil and gas exploration company, focusing its activities in the Cooper Basin of South Australia. Production improved by 19% in FY20 over the prior year on the back of commissioning of sole gas. Average realization of gas price improved to $8.99/GJ in FY20, up from $7.92/GJ reported in FY19. Its oil revenues declined by 38% owing to a decline in sales volume and oil price. EBITDA margin contracted to 30.8% in FY20 from 47.3% reported in FY19 mainly due to a $11 million increase in the cost of sales and costs related to early cessation of its Minerva plant. Its profitability was impacted by the development cost of under-developed projects, higher royalty fees, and interest costs.
In the recent quarter performance, COE posted a 10.0% increase in production volumes in Sep’20 quarter over June’20 quarter. The company has taken Athena Gas Plant Project which is expected to be completed in a year. Gas price realization declined to $5.61/GJ owing to low spot prices. Oil sales continue to decline in Sep’20 quarter. COE maintained stable revenues in Sep’20 quarter (at $24.0 million in-line with June’20 quarter). It had closed the quarter with a cash balance of $133.6 million. No new borrowings in-place. Net debt stood at $95.8 million as of Sep’20.
Outlook: Revenues are expected to benefit from various activities – long-term contract for Sole gas committed to 2025 and supply to start from December 2020 and January 2021, its Casino Henry partially contracted for FY21 and Athena Gas Plant Project is underway. Management is expecting a substantial uplift in gas production, revenues and cash flow in FY21. The company has become carbon neutral in FY20.
COE is expected to benefit from rapid growth in consumption of copper which is expected to lift prices to US$6,570/tonne in 2022. Copper exports is likely to increase 3.0% in 2021-22 to reach $11 billion as per the Department of Industry, Science, Energy and Resources.

Valuation Methodology: EV/Sales Multiple Based Relative Valuation (Illustrative)
.png)
EV/Sales Multiple Based Relative Valuation (Source: Refinitiv, Thomson Reuters)
Note: All forecasted figures and peers have been taken from Thomson Reuters, NTM-Next Twelve Months

A-VIX vs COE (Source: Refinitiv, Thomson Reuters)
Stock Recommendation:The stock posted 3-positive returns of ~7.042%. It is currently trading below to the average of 52-week high price of $0.620 and 52-week low price of $0.295. COE posted stable revenues in Sep’20 quarter, with increase in gas sales volumes. Its Sole gas supply agreement to commence. The company is expecting a lower capex to be in the range of $50-58 million for FY21 (vs. $76.7 million in FY20). The stock performed well over the market volatility index. We have valued the stock using the EV/ Sales multiple based illustrative relative valuation method and arrived at a target price of low double-digit upside (in percentage terms). For this purpose, we have taken peers such as Senex Energy Ltd. (ASX: SXY), Australis Oil & Gas Ltd. (ASX: ATS), Energy Resources Of Australia Ltd. (ASX: ERA), to name a few. Considering the stable revenues in Sep’20 quarter, long-term supply contract, the current valuation and trading levels, we give a “Speculative Buy” recommendation on the stock at the current market price of $0.380, down by 3.798% on 11th January 2021.
(M-cap: A$ 678.11 Million, Annual Dividend Yield: 0%)

Uptick in Sales and Push for Branded Beef: Australian Agricultural Company Ltd. (ASX: AAC) is an integrated cattle and beef producer with principal activities in pastoral properties, production of beef and processing of cattle. AAC reported strong sales across all regions in FY20. Its Wagyu beef sales clocked revenue growth of +19.7% in FY20 over prior year driven by improvement in price and volumes. The company targeted USA and Europe for premium beef products. It had inked new distribution partnerships in Hong Kong and Singapore. China saw increased offtake for high-value loin cuts. US sales benefited from catering to the high-end food services sector. Westholme presence in Canada continues to grow. AAC launched Westholme in London. The company is spreadheading branded sales growth in Australia. It had reported a statutory EBITDA of $80.1 million in FY20 as compared to a loss of $182.7 million in the prior year. This was led by a reversal of $102.4 million in unrealized losses from a decline in the livestock market in the prior year. In addition, AAC reported savings of $30.8 million from lower operating expenses.
H1 FY21 update: AAC posted a 9% decline in production volumes in H1 FY20 over pcp. Its food services exports market was impacted by lockdown restrictions. The company continue to push branded beef strategy and achieved a 14.5% increase in dollar value per kg of meat sales partly offsetting drop in volumes. Cattle sales were impacted by the destocking of inventory. AAC streamlined the supply chain and saved about $22 million in operating costs. It had reported a statutory EBITDA of $15.0 million in H1 FY21 as compared to a loss of $3.4 million in pcp. Net financing cost reduction of $25.9 million resulted in a cash balance of $14.2 million as of Sep’20. It had adequate headroom for borrowings to the tune of $190 million.
Outlook: AAC is expecting lower meat sales in H2 FY21 and cattle sales to decline in H2 FY21. Outlook to remain uncertain owing to new waves of the outbreak in Europe. It is positioning the US and EU as premium markets for beef products. The company to continue to pursue a branded beef strategy, re-prioritizing operating expenses and temporary stand-downs to counter the pandemic impact.

Valuation Methodology: Price/ Book Value Multiple Based Relative Valuation (Illustrative)

Price/ Book Value Multiple Based Relative Valuation (Source: Refinitiv, Thomson Reuters)
Note: All forecasted figures and peers have been taken from Thomson Reuters, NTM-Next Twelve Months

A-VIX vs AAC (Source: Refinitiv, Thomson Reuters)
Stock Recommendation: The stock posted 1-month returns of +4.74%, while 3-month returns turned negative to -1.34%. It is trading slightly below to the average of 52-week high price of $1.330 and 52-week low price of $0.945. AAC reported better profitability in H1 FY21 with statutory EBITDA of $15.0 million in H1 FY21 as compared to loss of $3.4 million in pcp. It had reported uptick in realization partly offsetting dip in volumes. AAC is spreaheading branded beef strategy in Australia. Its debt levels declined with debt/equity at 0.42x as of Sep’20 as compared to 0.49x reported in last year comparable period. The stock well performed over the market volatility index. We have valued the stock using the Price/ Book Value multiple based illustrative relative valuation method and arrived at a target price of low double-digit upside (in percentage terms). For this purpose, we have taken peers such as Elders Ltd. (ASX: ELD), Huon Aquaculture Group Ltd. (ASX: HUO), Tassal Group Ltd. (ASX: TGR), to name a few. Considering the uptick in realization in H1 FY21, lower debt levels, outlook and strategy, the current valuation and trading levels, we give a “Hold” recommendation on the stock at the current market price of $1.105, down by 1.778% on 11th January 2021.
(4) Ridley Corporation Ltd. (Recommendation: Hold, Potential Upside: Low Double Digit)
(M-cap: A$ 305.11 Million, Annual Dividend Yield: 1.57%)

Significant Non-Recurring Items Dented Profits: Ridley Corporation Ltd. (ASX: RIC) provides and distributes animal feed products for the beef, dairy, pig and poultry industry. RIC completed Wellsford Feedmill in Bendigo. It also completed the acquisition of the Novacq production ponds in Thailand and the remaining 51% of the adjacent feedmill. It had reported a 3.5% decline in revenues in FY20 over the prior year due to the expiry of Inghams supply agreement. Its EBITDA margin contracted to 1.8% in FY20 as compared to 4.9% reported in FY19 reflecting weak pricing and lower sales volumes amidst COVID-19. RIC incurred sizeable one-time non-recurring expenses totalling $43.2 million in FY20, led by impairment of Novacq, closure of Murray Bridge feedmill facility and restructuring of Northern Victorian operations. It had reported net loss of $8.6 million in FY20 as compared to a profit of $23.6 million in FY19. Its profitability was also impacted by the high carrying of raw material inventories to combat international supply chain disruptions. It had closed the full-year 2020 with a cash balance of $45.8 million. Borrowings increased towards completion of new Westbury extrusion plant and construction of new feedmill at Wellsford. Net debt stood at $147.2 million as of June 2020. RIC had headroom to borrow $80 million against Term and Receivables facilities.
Outlook: RIC experienced new business wins in the poultry, pig, equine and aquaculture sector during the first quarter of 2021. Both domestic and export markets to grow in FY21 with Novacq to witness the doubling of production. It had suspended the final dividend payout for FY20 to pair-down the debt. The company is targeting to bring down the net debt to EBITDA to 2x from the current levels of 2.5x as of June 2020. It had appointment new members to the Board - Mick McMahon as a Director and Ridley Chair from 27 August 2020; Rhys Jones as a Director from 27 August 2020.
With cattle prices are projected to increase by 23% in 2020-21 due to restocking demand, RIC to report better realization and improved EBITDA going forward.

Valuation Methodology: Price/Cash Flow Multiple Based Relative Valuation (Illustrative)

Price/ Cash Flow Multiple Based Relative Valuation (Source: Refinitiv, Thomson Reuters)
Note: All forecasted figures and peers have been taken from Thomson Reuters, NTM-Next Twelve Months

A-VIX vs RIC (Source: Refinitiv, Thomson Reuters)
Stock Recommendation: The stock posted 3-month and 6-month positive returns of 12.35% and 29.93%, respectively. It is trading slightly above to the average of 52-week high price of $1.140 and 52-week low price of $0.655. RIC experienced increased business wins during Q1 FY21 and is expecting doubling of production capacity at Novacq facility. It had taken debt for asset renewal program and now the program stands completed, the company is focusing on reducing debt levels. The stock performed well over the market volatility index. We have valued the stock using the Price/ Cash Flow multiple based illustrative relative valuation method and arrived at a target price of low double-digit upside (in percentage terms). For this purpose, we have taken peers such as Tassal Group Ltd. (ASX: TSL), Inghams Group Ltd. (ASX: ING), Elders Ltd. (ASX: ELD), to name a few. Given the new business wins in Q1 FY21, debt reduction plan, the current valuation and trading levels, we give a “Hold” recommendation on the stock at the current market price of $0.955, with no change in price as on 11th January 2021.
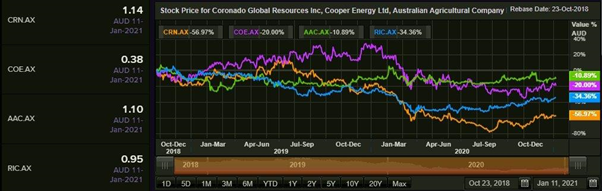
Comparative Price Chart (Source: Refinitiv, Thomson Reuters)
Disclaimer
The advice given by Kalkine Pty Ltd and provided on this website is general information only and it does not take into account your investment objectives, financial situation or needs. You should therefore consider whether the advice is appropriate to your investment objectives, financial situation and needs before acting upon it. You should seek advice from a financial adviser, stockbroker or other professional (including taxation and legal advice) as necessary before acting on any advice. Not all investments are appropriate for all people. Kalkine.com.au and associated pages are published by Kalkine Pty Ltd ABN 34 154 808 312 (Australian Financial Services License Number 425376). The information on this website has been prepared from a wide variety of sources, which Kalkine Pty Ltd, to the best of its knowledge and belief, considers accurate. You should make your own enquiries about any investments and we strongly suggest you seek advice before acting upon any recommendation. Kalkine Pty Ltd has made every effort to ensure the reliability of information contained in its newsletters and websites. All information represents our views at the date of publication and may change without notice. To the extent permitted by law, Kalkine Pty Ltd excludes all liability for any loss or damage arising from the use of this website and any information published (including any indirect or consequential loss, any data loss or data corruption). If the law prohibits this exclusion, Kalkine Pty Ltd hereby limits its liability, to the extent permitted by law to the resupply of services. There may be a product disclosure statement or other offer document for the securities and financial products we write about in Kalkine Reports. You should obtain a copy of the product disclosure statement or offer document before making any decision about whether to acquire the security or product. The link to our Terms & Conditions has been provided please go through them and also have a read of the Financial Services Guide. On the date of publishing this report (mentioned on the website), employees and/or associates of Kalkine Pty Ltd do not hold positions in any of the stocks covered on the website. These stocks can change any time and readers of the reports should not consider these stocks as personalised advice.
Past performance is not a reliable indicator of future performance.
 Please wait processing your request...