Section 1: Company Overview and Key Earnings Metrics
Company Overview: Universal Store Holdings Limited (ASX: UNI) is a retailer specializing in trend-led and casual men’s and women’s fashion, shoes, accessories, lifestyle, and gifting. The Company owns a portfolio of premium youth fashion brands and omnichannel retail and wholesale businesses. Kalkine’s Earnings Hunter Report covers the Key Financial Metrics, Risks, Outlook, Technical Analysis along with the earnings hunter score and rating on the stock.

Section 2: Earnings Hunter Score and Financial Dashboard
Section 3: Strategic Update and Key Catalysts
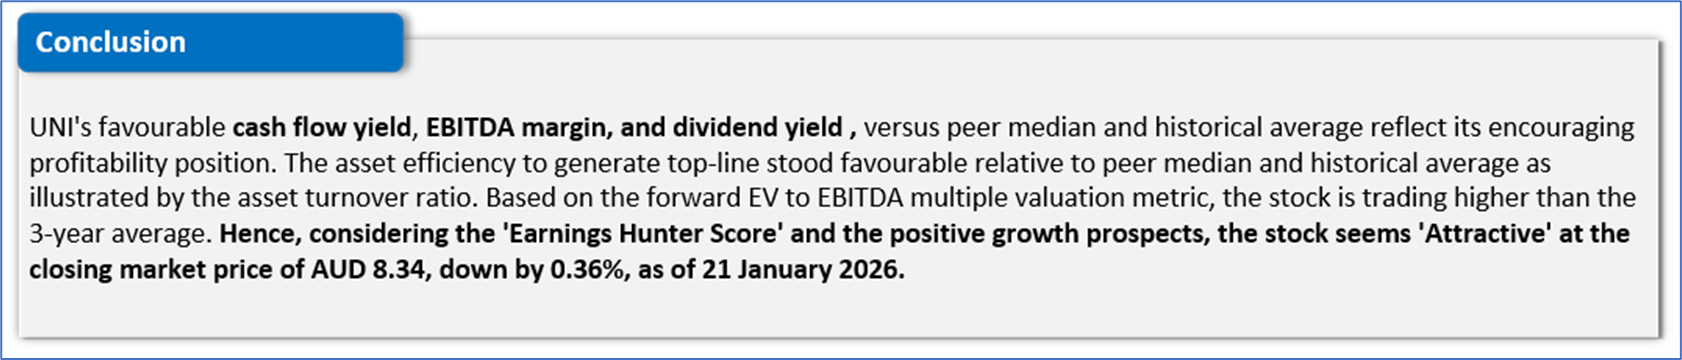
Section 4: Price Performance, Technical Summary, and Conclusion
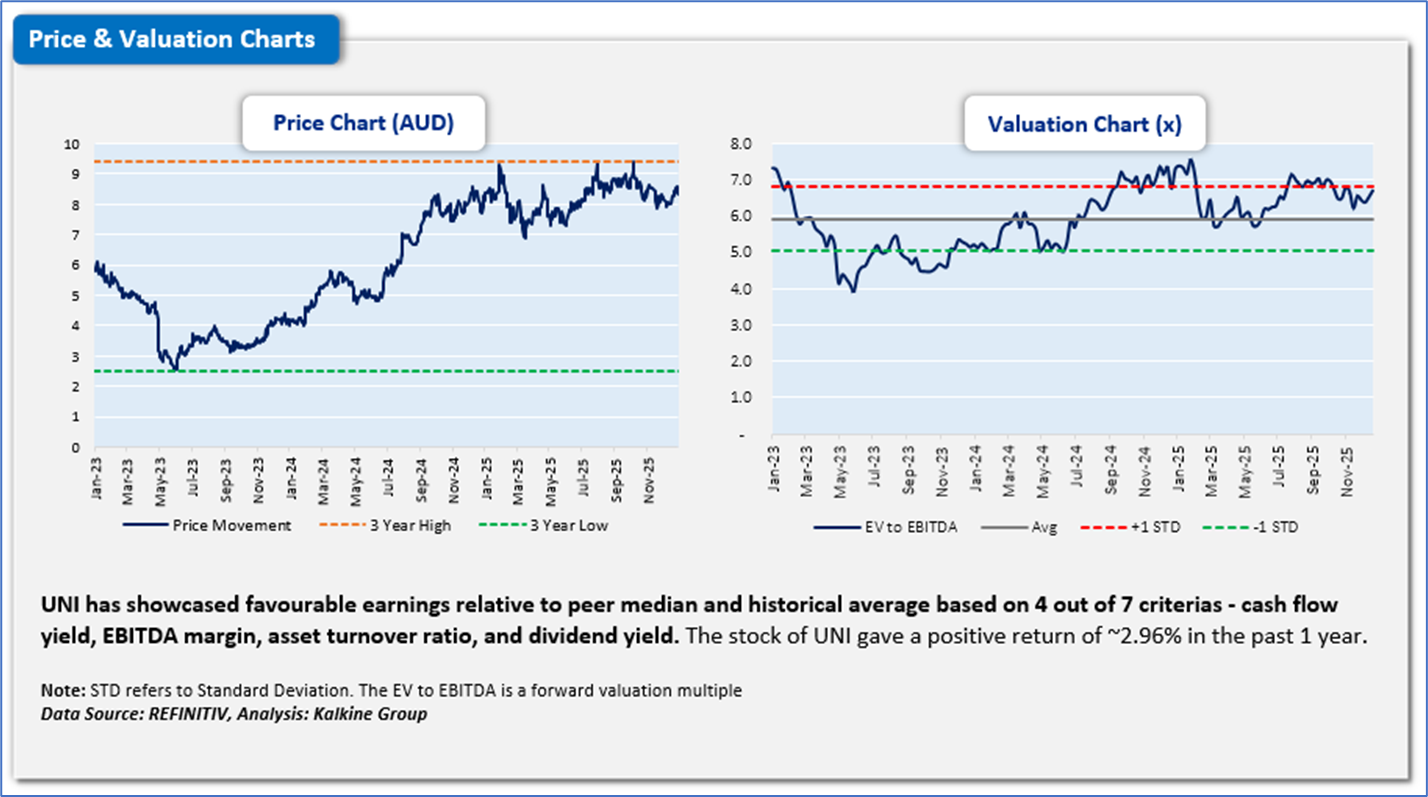
The stock has gained around ~1.96% in the last one month, and over the past one year, it went up by ~2.96%. The stock has a 52-week low and 52-week high of AUD 6.580 and AUD 9.88, respectively, and is currently trading above the 52-week high-low average. UNI was last covered in a report dated ‘17 December 2025’.
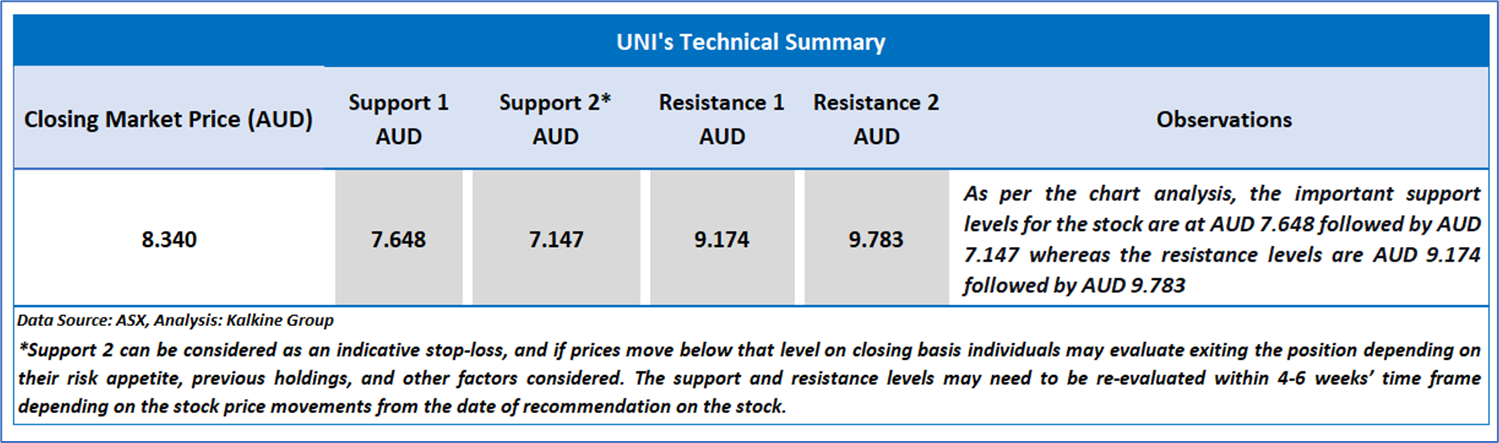
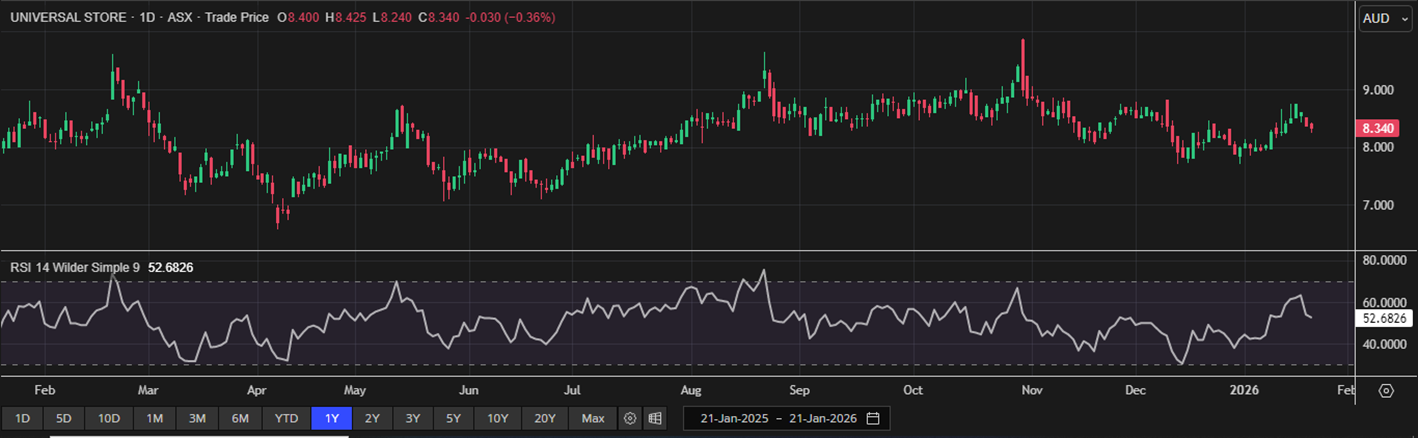 UNI Daily Technical Chart, Data Source: REFINITIV
Notes:
Note 1: Past performance is neither an Indicator nor a guarantee of future performance.
Note 2: The reference date for all price data, currency, technical indicators, support, and resistance levels is 21 January 2026. The reference data in this report has been partly sourced from REFINITIV.
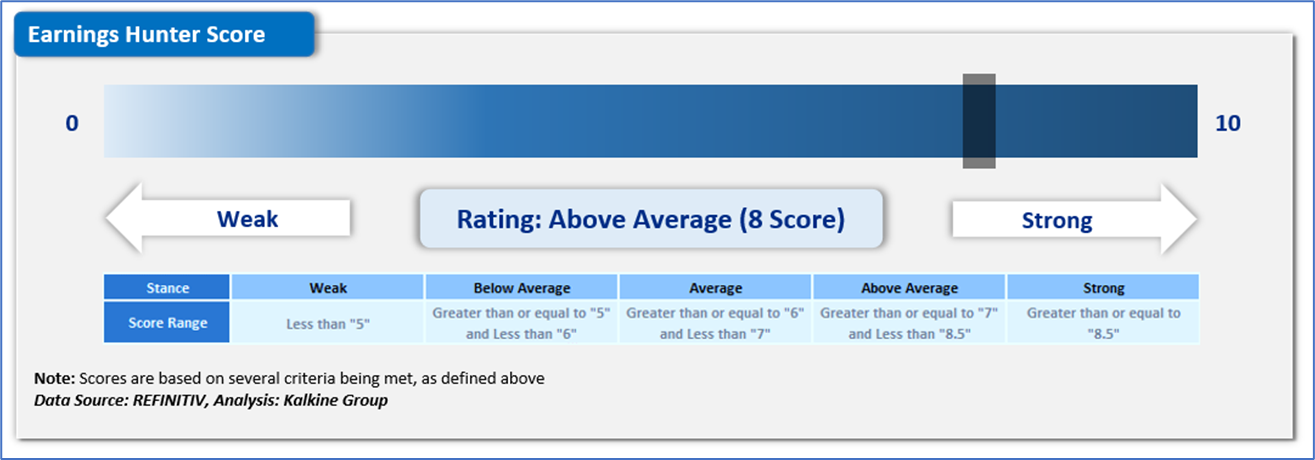
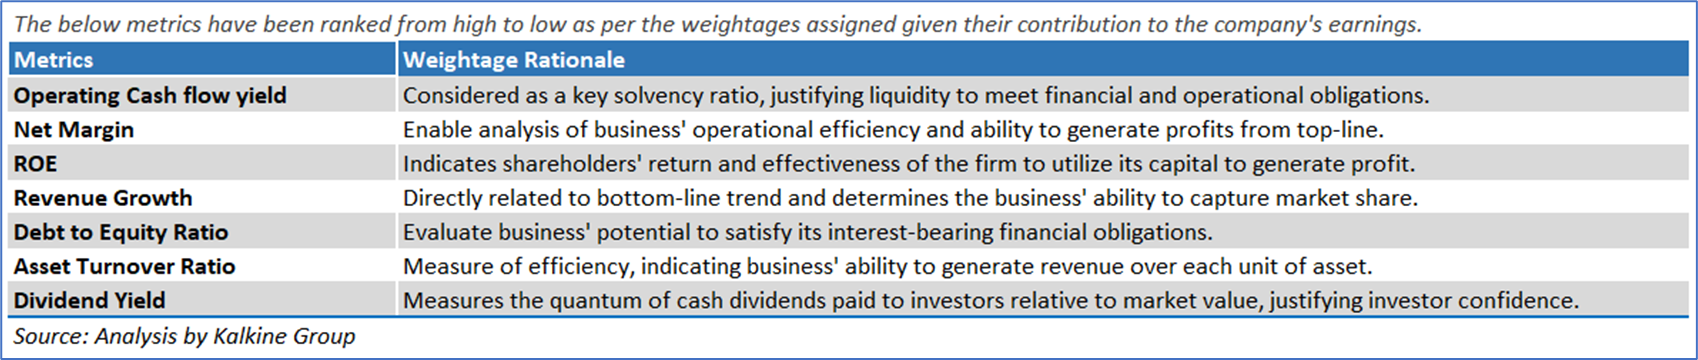
Note 3: Investment decisions should be made depending on an individual's appetite for upside potential, risks, holding duration, and any previous holdings. The ‘Earnings Hunter Score’ typically provides an indication on the stance of the stock based on certain earnings-related criteria and the company’s performance versus the historical average and peers’ median.
Note 4: Kalkine reports are prepared based on the stock prices captured either from REFINITIV or Trading View. Typically, REFINITIV or Trading View may reflect stock prices with a delay which could be a lag of 25-30 minutes. There can be no assurance that future results or events will be consistent with the information provided in the report. The information is subject to change without any prior notice.
Technical Indicators Defined: -
Support: A level at which the stock prices tend to find support if they are falling, and a downtrend may take a pause backed by demand or buying interest. Support 1 refers to the nearby support level for the stock and if the price breaches the level, then Support 2 may act as the crucial support level for the stock.
Resistance: A level at which the stock prices tend to find resistance when they are rising, and an uptrend may take a pause due to profit booking or selling interest. Resistance 1 refers to the nearby resistance level for the stock and if the price surpasses the level, then Resistance 2 may act as the crucial resistance level for the stock.
Stop-loss: It is a level to protect further losses in case of unfavourable movement in the stock prices.
Past performance is not a reliable indicator of future performance.

 CA
 NZ
 UK
 US
 IND

 AU

 Please wait processing your request...