Kalkine has a fully transformed New Avatar.

Company Overview: On Holding AG (NYSE: ONON) is a Switzerland-based company active in athletic sports accesories industry. The Company provides footwear and sports apparel and is engaged in developing and distributing performance sports products, through independent retailers and global distributors. Embraer S.A. (NYSE: ERJ) designs, develops, manufactures, and sells aircraft and systems in North America, Latin America, the Asia Pacific, Brazil, Europe, and internationally. This Report covers the Price Action, Technical Indicators Analysis along with the Target Levels, Stop Loss, Support Levels, Resistance Levels, and Recommendations on these two stocks.
US Markets Round-Up
This week, the Russell 3000 index, an important benchmark of the US stock market across market capitalizations, started the week on a positive note and continued the momentum. The index made a high of 3627.69 during the week and settled at 3617.10 with a week-to-date (WTD) gain of ~0.949 percent on July 24, 2025. Other major indices, such as S&P 500 and NASDAQ Composite, witnessed upside movement for the week. On July 24, 2025, the S&P 500 index settled at ~6363.36 with a WTD gain of ~1.07 percent, while the NASDAQ Composite Index settled at 21057.95 with a WTD gain of ~0.777 percent.
Having understood the US market performance over the week, taking cues from major global news, and based on technical analysis of the Russell 3000 index for the upcoming week, now let’s have a look at the two US-listed stocks to pick from the technical standpoint. Noted below recommendations are based on the entry price, target prices, and stop-loss for On Holding AG (NYSE: ONON) and Embraer S.A. (NYSE: ERJ) for the next 2-4 weeks duration:

On Holding AG (NYSE: ONON)
Noted below are the key price indicators for the stock:

Price Action Analysis (on the Daily Chart)
ONON's stock price is currently hovering near its descending trendline support levels, indicating the possibility of an upcoming upward move. The next key resistance is seen at USD 60.39. Over the next 2-4 weeks, the stock is expected to test this level, which could trigger a response. If the stock manages to break above USD 60.39, it may attract additional buying interest, potentially driving the stock's upward trajectory further.
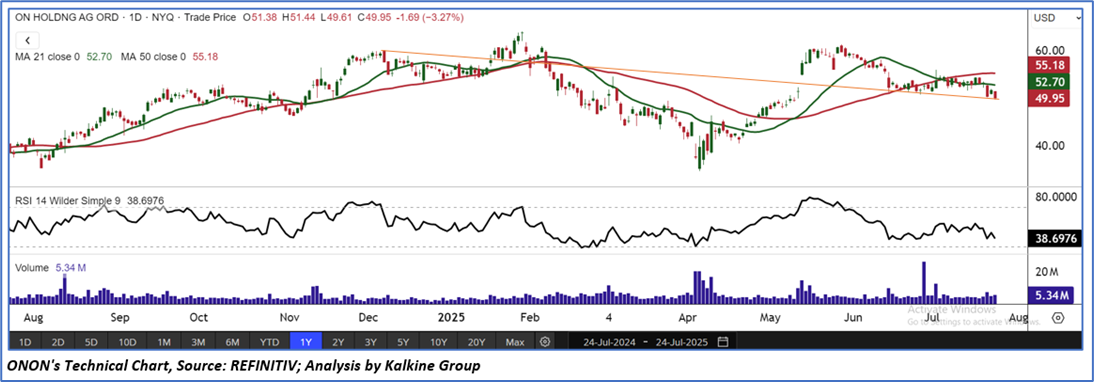

Technical Indicators Analysis (On the Daily Chart)
On the daily chart, the RSI (14-period) is currently below the midpoint with a reading of 38.69 and may potentially move higher. Additionally, trading volumes suggest supporting signs for an imminent upward movement. Moreover, the prices are trading below the 21-period and 50-period SMAs, which are likely to act as near-term resistance levels.

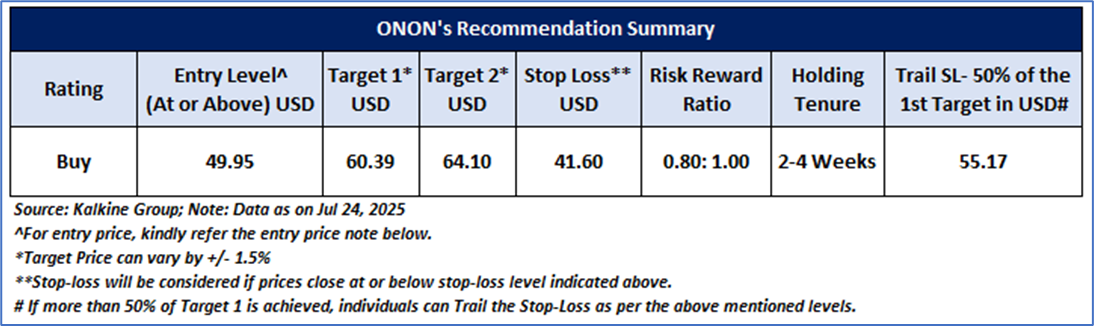
General Recommendation
As per the above-mentioned price action and technical indicators analysis, On Holding AG (NYSE: ONON) is looking technically well-placed on the chart, and a ‘Buy’ recommendation has been given on the stock. Investment decision should be made depending on an individual’s appetite for upside potential, risks, and any previous holdings. This recommendation is purely based on technical analysis, and fundamental analysis has not been considered in this report. The summary of recommendations is as follows:
Embraer S.A. (NYSE: ERJ)
Noted below are the key price indicators for the stock:

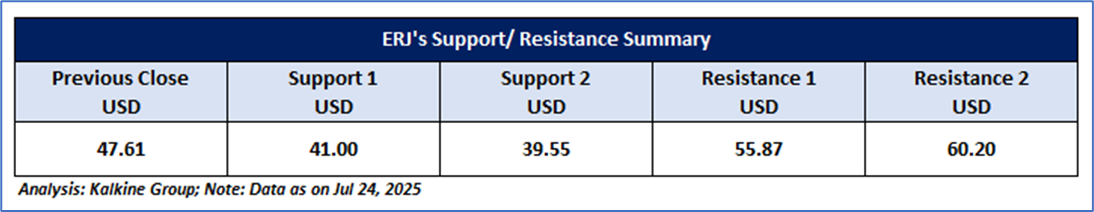
Price Action Analysis (on the Daily Chart)
ERJ's stock price is currently hovering near multiple trendline support levels one from a declining trendline and another from a long-term upward trendline. The recent selling momentum may become imbalanced, increasing the likelihood of a price reversal from current levels. The next significant resistance is identified at USD 55.87. Over the next 2-4 weeks, the stock is anticipated to test this level, potentially prompting a reaction. If the stock manages to break above USD 55.87, it could trigger increased buying interest and further propel its upward movement.

Technical Indicators Analysis (On the daily Chart)
On the daily chart, the leading indicator RSI (14-period) is approaching oversold territory, currently reading 35.25, which could indicate a potential sell imbalance at this level. Additionally, trading volumes appear supportive of an imminent upward move. Furthermore, the prices are trading below the 21-period and 50-period SMAs, which are likely to serve as near-term resistance levels.

General Recommendation
As per the above-mentioned price action and technical indicators analysis, Embraer S.A. (NYSE: ERJ) is looking technically well-placed on the chart, and a ‘Speculative Buy’ recommendation has been given on the stock. Investment decision should be made depending on an individual’s appetite for upside potential, risks, and any previous holdings. This recommendation is purely based on technical analysis, and fundamental analysis has not been considered in this report. The summary of recommendations is as follows:

Upcoming Major Global Economic Events
Market events occur on a day-to-day basis depending on the frequency of the data and generally include an updates GDP, Unemployment Data, etc. Noted below are the upcoming week's major global economic events that could impact the Russell 3000 Index and stocks’ prices:

Related Risks: This report may be looked at from a high-risk perspective and recommendations are provided for a short duration. Recommendations provided in this report are solely based on technical parameters, and the fundamental performance of the stocks has not been considered in the decision-making process. Other factors which could impact the stock prices include market risks, regulatory risks, interest rates risks, currency risks, social and political instability risks etc.
Note 1: Individuals can consider exiting from the stock if the Target Price or Stop loss mentioned as per the technical analysis has been achieved and subject to the factors discussed above.
Note 2: How to Read the Charts?
The Green colour line reflects the 21-period moving average while the red line indicates the 50- period moving average. SMA helps to identify existing price trends. If the prices are trading above the 21-period and 50-period moving average, then it shows prices are currently trading in a bullish trend.
The Black colour line in the chart's lower segment reflects the Relative Strength Index (14-Period) which indicates price momentum and signals momentum in trend. A reading of 70 or above suggests overbought status, while a reading of 30 or below suggests an oversold status.
The Blue colour bars in the chart’s lower segment show the volume of the stock. The volume is the number of shares that changed hands during a given day. Stocks with high volumes are more liquid than stocks with lesser volume as liquidity in stocks helps in easier and faster execution of the order.
The Orange colour lines are the trend lines drawn by connecting two or more price points and used for trend identification purposes. The trend line also acts as a line of support and resistance.
Technical Indicators Defined: -
Support: A level at which the stock prices tend to find support if they are falling, and a downtrend may take a pause backed by demand or buying interest. Support 1 refers to the nearby support level for the stock, and if the price breaches the level, then Support 2 may act as the crucial support level for the stock.
Resistance: A level at which the stock prices tend to find resistance when they are rising, and an uptrend may take a pause due to profit booking or selling interest. Resistance 1 refers to the nearby resistance level for the stock, and if the price surpasses the level, then Resistance 2 may act as the crucial resistance level for the stock.
Stop-loss: It is a level to protect further losses in case of unfavourable movement in the stock prices.
Risk Reward Ratio: Risk reward ratio is the difference between an entry point to a stop loss and profit level. This report is based on ~60% Stop Loss of the Target 1 from the entry point.
A trailing stop-loss is a modification of stop-loss in case of favourable movement in the price to protect the gains. Individuals can Trail the Stop-Loss as per the aforementioned levels if the stock price achieves more than 50% of the Target 1. Individuals should consider exiting from the position as per the Trailing Stop-Loss level if the price starts moving downwards after achieving more than 50% of the Target 1.
The reference date for all price data, currency, technical indicators, support, and resistance levels July 24, 2025. The reference data in this report has been partly sourced from REFINITIV.
Abbreviations
CMP: Current Market Price
SMA: Simple Moving Average
RSI: Relative Strength Index
USD: United States dollar
Note: Trading decisions require a thorough analysis by individuals. Technical reports in general chart out metrics that may be assessed by individuals before any stock evaluation. The above are illustrative analytical factors used for evaluating the stocks; other parameters can be looked at along with additional risks per se. Past performance is neither an indicator nor a guarantee of future performance.
This report (“Report”) has been issued by Kalkine Pty Limited (ABN 34 154 808 312) (Australian financial services licence number 425376) (“Kalkine”) and prepared by Kalkine and its related bodies corporate who are authorised to provide general financial product advice. Kalkine.com.au and its associated pages are published by Kalkine.
Any advice provided in this Report is general advice only and does not take into account your objectives, financial situation or needs. You should therefore consider whether the advice is appropriate for your objectives, financial situation and needs before acting upon it.
There may be a Product Disclosure Statement, Information Memorandum or other offer document (“Offer Document”) for the securities or other financial products referred in this Report. You should obtain a copy of the relevant Offer Document and consider it before making any decision about whether to acquire the security or financial product.
Kalkine strongly recommends that you seek advice from a financial adviser, stockbroker or other professional (including taxation and legal advice) before acting on any of the general advice in this Report or on the Kalkine website. Not all investments are appropriate for all people.
The information in this Report and on the Kalkine website has been prepared from a wide variety of sources, which Kalkine, to the best of its knowledge and belief, considers accurate. Kalkine has made every effort to ensure the reliability of the information contained in its reports (including this Report), newsletters and websites. All information represents our views at the date of publication and may change without notice.
The information in this Report does not constitute an offer to sell securities or other financial products or a solicitation of an offer to buy securities or other financial products. Our reports contain general recommendations to invest in securities and other financial products. Kalkine is not responsible for, and does not guarantee, the performance of, or returns on, any investments mentioned in this Report.
Kalkine does not issue, sell or deal in any financial products.
This Report may contain information on past performance of particular investments. Past performance is not a reliable indicator of future performance. Returns stated do not take into account transaction costs and taxes. To the extent permitted by law, and excluding any dishonesty or gross negligence by Kalkine, Kalkine disclaims and excludes all liability for any direct, indirect, implied, punitive, special, incidental or other consequential loss or damage arising from the use of or reliance on this Report, the Kalkine website and any information published on the Kalkine website without any warranties or representations by Kalkine to you. To the extent the law prohibits or limits this exclusion, Kalkine limits its liability to the resupply of services.
Please also read our Terms & Conditions and Financial Services Guide for further information. Employees and/or associates of Kalkine and its related entities may hold interests in the securities or other financial products covered in this Report or on the Kalkine website. Any such employees and associates are required to comply with certain, procedures and disclosures as required by law.
Kalkine Media Pty Ltd, an affiliate of Kalkine Pty Ltd, may have received, or be entitled to receive, financial consideration in connection with providing information about certain entity(s) covered on its website including entities covered in this Report.
Copyright 2025 Krish Capital Pty. Ltd. (ABN 61629651510). All Rights Reserved. No part of this report, or its content, may be reproduced in any form without our prior consent.
Past performance is not a reliable indicator of future performance.
 Please wait processing your request...