Kalkine has a fully transformed New Avatar.

Company Overview: Twitter, Inc. (NYSE: TWTR) is a worldwide platform that links users to a network of people, news, ideas, and knowledge. Twitter is available in more than 40 languages worldwide. The service can be availed through twitter.com, SMS and a range of mobile devices that includes Twitter for iPhone and Twitter for Android. The company’s revenue mostly varies on advertisers and actual active users. The company’s expanding database aids marketers to aim audiences based on gender, interests, geography, keyword, etc.
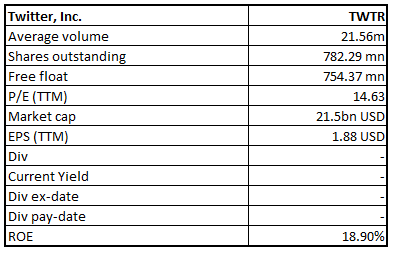
TWTR Details
TWTR Rides on Higher Ad Revenues & Growing User Base: Twitter, Inc. (NYSE: TWTR) has its headquarters in San Francisco, California, and is a global platform that connects users to a network of people, news, ideas, and knowledge. A user can tweet his/her take on any topic on a real-time basis which is limited to 280 characters, which again can be retweeted by others. The company allows users to explore and discover content according to their interests, which includes tweets that may have add-ons like links, media, photos, and other applications. Consequently, Twitter persists to make its platform more enjoyable for users to drive further growth.
The company has two reportable segments namely Advertising Services, which accounted for ~87% of FY19 total revenues and Data Licensing, which accounted for the remaining 13% of total revenues. The company evaluates the number of users via the monetizable daily active users (mDAU) metric. Average mDAUs stood at 152 million in FY19, up 21% year over year. User growth in FY19 was primarily aided by product enhancements along with the company’s initiatives to provide appropriate content and notification to people’s Home on real time basis. The company made maximum of its revenues from advertisers using its Products like promoted tweets, accounts, and trends. In FY19, the company reported revenues of ~$3.46 billion, up from $3.04 billion reported in FY18.
Notably, in a recent update, Twitter stated that its average total mDAU reached ~164 million in 1QFY20, soaring 23% from 134 million in 1QFY19 and up 8% from 152 million in 4QFY19. The increase can primarily be attributed to frequent discussions on the global issue of coronavirus-led crisis and ongoing product improvements.
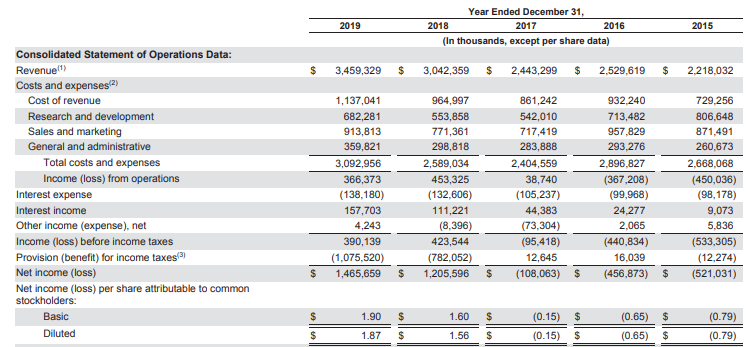
Coming to the past performance over the period covering FY15 to FY19, TWTR witnessed a top-line CAGR of ~11.7%. Diluted earnings per share stood at $1.87, as compared to a loss of 79 cents per share reported in FY15. Net income over the same time increased to $1.47 billion in FY19, as compared to a loss of $521 million in FY15.
Key Trends (Source: Company Reports)
Going forward, the company’s strategies to surge features and focus more on blocking online abuses have supported the company to expand its user base. Further, the company sees the potential to increase revenues in the future on the back of a growing user base and a higher level of commitment from its users. The company’s video ad formats persist to show strength, particularly in its In-Stream Video Ads and Video Website Card. This momentum is expected to prevail in the future.
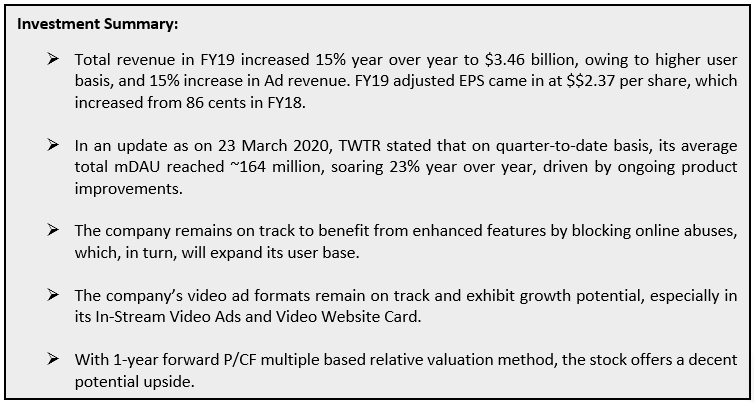
FY19 Financial Highlights for the period ended 31 December 2019: The company reported FY19 non-GAAP earnings of $2.37 per share, which increased from 86 cents reported in the previous year. Total revenue for the period increased 15% on a constant currency basis year over year and came in at $3.46 billion. The increase in revenues can primarily be attributed to a higher user basis, and 15% increase in Ad revenue, owing to a 21% growth in the United States. Average mDAU in FY19 came in at 152 million, up from 126 million in FY18. Average U.S. mDAU was 31 million, up from 27 million reported in the previous year. Furthermore, average international mDAU soared 22% year over year and came in at 121 million. Markedly, mDAU progress was broad-based, with the double-digit surge in all its top 10 markets. Twitter’s total costs and expenses were $2.7 billion, up from $2.2 billion reported in FY18. Adjusted EBITDA stood at $1.21 billion, up slightly from $1.2 billion reported in FY18.
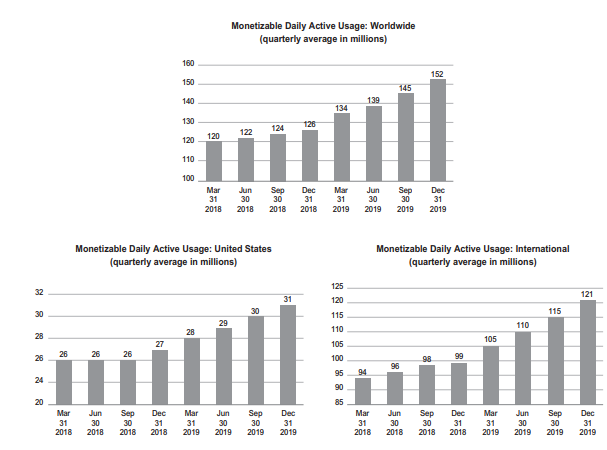
Monetizable Daily Active Users (Source: Company Reports)
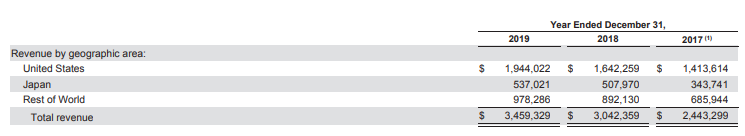
Geographical Contribution: U.S. revenue stood at $1.94 billion, up 18% year over year and accounted for ~56% of total revenues. International revenue posted a year over year growth of 8% and came in at $1.52 billion and accounted for 44% of total revenues.
Geographical Contribution (Source: Company Reports)
Advertising Metrics: Advertising revenues in FY19 came in at $2.99 billion, up 14% year over year. U.S.advertising revenue stood at $1.64 billion in FY19, an increase of 21% from the year-ago period. International ad revenue was up 7% on year over year basis and came in at $1.36 billion in FY19.
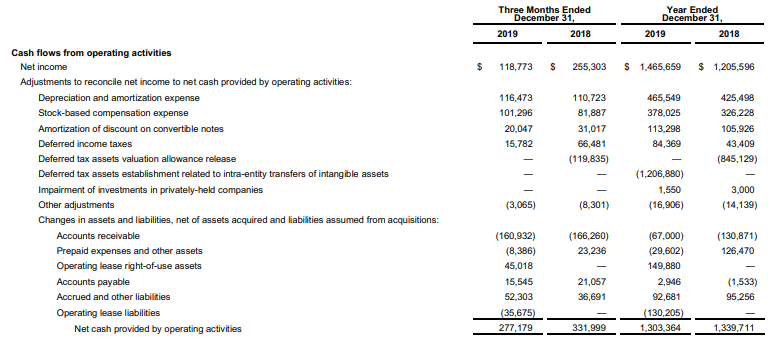
Balance Sheet & Cash Flow Position: The company exited the period, with cash and cash equivalents and marketable securities of $6.64 billion, which includes $692 million of net proceeds of $692 towards the new long-term debt, which was issued by the company for over-all corporate purposes in December 2019. In FY19, adjusted free cash flow stood at $768.8 million, down from $852.8 million in FY18. Net cash provided from operating activities in FY19 came in at $1.3 Billion as compared to $1.34 billion in the year-ago quarter.
Cash Flow Highlights (Source: Company Reports)
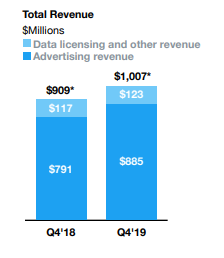
Sneak-Peek at 4QFY19 Key Highlights: During the quarter, the company reported revenues of ~$1 billion, up around 11% year over year. Further, the company made progress to ease users to search for the best content on Twitter by allowing them to go after Topics, which remains a key growth catalyst. As on December 31, 2019, the company stated there were greater than 1,700 Topics in ~6 languages, that people were able to follow, with fresh Topics being included per week. Twitter’s initiatives to reduce abuse on its platform have caused a 27% decline in bystander reports on Tweets that disrupt the company’s terms of service.
U.S. revenues during the quarter increased 17% year over year, whereas International revenues were up by 3%. Japan remained the company’s second-largest market in the fourth quarter. Notably, Ad engagements in fourth quarter increased 29% year over year, primarily backed higher clickthrough rates (CTR) across ad formats. Data licensing and other revenues stood at $122.8 million, up 5% year over year.
Revenues (Source: Company Reports)
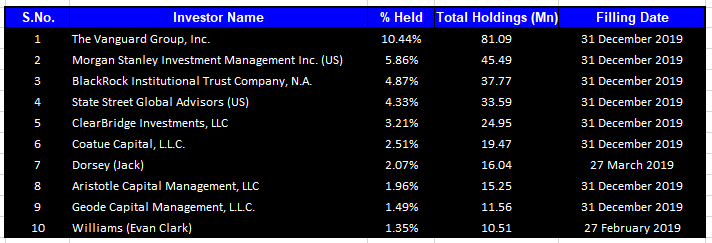
Top 10 Shareholders: The top 10 shareholders have been highlighted in the table, which together form around 38.09% of the total shareholding. The Vanguard Group, Inc. holds the maximum interest in the company at 10.44%, followed by Morgan Stanley Investment Management Inc. (US) with 5.86% interest in the company.
Top 10 Shareholders (Source: Thomson Reuters)
Key Metrics: In FY19, the company reported a gross margin and EBITDA margin of 67.1% and 25.9%, respectively. EBITDA margin for the quarter stood higher than the industry median of 16.1%. Net margin for FY19 stood at 42.4%, better than the industry median of 7.2%. In FY19, the company reduced its debt levels, reporting a decline in the debt-to-equity multiple from 0.40x in FY18 to 0.29x in 2019.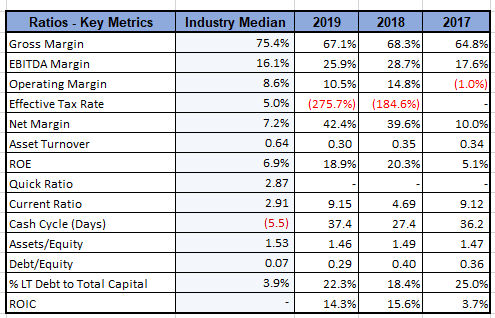
Key Metrics (Source: Thomson Reuters)
Latest Update: Twitter recently updated about the withdrawal of its 1QFY20 revenue and operating income guidance due to the COVID-19 anxiety on advertiser demand. However, the company is taking the necessary measures to curb misinformation on coronavirus. Twitter also stated that its average total mDAU went up 23% year over year to ~164 million in 1QFY20, owing to frequent discussions on the global issue of coronavirus-led crisis and ongoing product improvements.
Outlook: As more and more businesses are moving their operations to the cloud, the demand for aiding software and services will continue to grow. The rise in adoption of new technology by businesses and the abundance of connected consumer devices, helps people to connect and do business online which is also aiding growth. Rapid implementation of SaaS solutions, which help in providing applications to any user, at any time and from anywhere, on any device is a key growth area. Additionally, the industry is also benefitting from the ever-increasing need to secure cloud platforms, in the presence of growing cyber-attacks and hacking. Technology and Internet companies are developing applications for contact tracing and handling fake news related to Covid-19, which is praiseworthy.
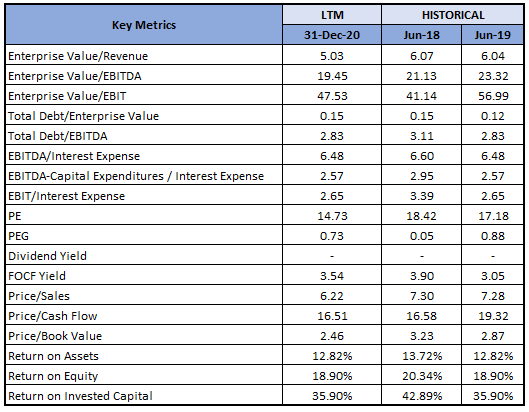
Key Valuation Metrics (Source: Thomson Reuters)
Valuation Methodology: Price to Cashflow Multiple Based Valuation 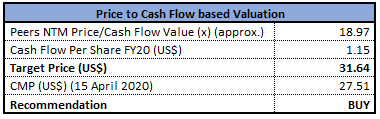
Price to Cashflow Based Valuation (Source: Thomson Reuters)
Note: All forecasted figures and peers have been taken from Thomson Reuters, NTM-Next Twelve Months
Stock Recommendation: The stock of TWTR as on 15 April 2020 closed at $27.55 with a market capitalization of $21.5 billion. The stock made a 52-week low and high of $20 and $45.86 and is currently trading below the average of its 52-week trading range. The stock has corrected ~18.71% in the last one year. The company remains on track to increase its revenues in the long-term, given a growing user base and a higher level of commitment from its users. Furthermore, the company’s schemes to identify rule breaches and boost the safety of users amid COVID-19 crisis are key positives.We have valued the stock using Price to Cashflow multiple based illustrative relative valuation method and arrived at the target price of lower double-digit upside (in % term). For the purpose, we have taken peers like Facebook Inc (NASDAQ: FB), Alphabet Inc (NASDAQ: GOOGL), Cloudera Inc (NASDAQ: CLDR), to name few. Hence, we recommend a “Buy” rating on the stock at the closing price of $27.51 per share, down 1.54% as on 15 April 2019.
.jpg)
TWTR Daily Technical Chart (Source: Thomson Reuters)
Disclaimer
The advice given by Kalkine Pty Ltd and provided on this website is general information only and it does not take into account your investment objectives, financial situation or needs. You should therefore consider whether the advice is appropriate to your investment objectives, financial situation and needs before acting upon it. You should seek advice from a financial adviser, stockbroker or other professional (including taxation and legal advice) as necessary before acting on any advice. Not all investments are appropriate for all people. Kalkine.com.au and associated pages are published by Kalkine Pty Ltd ABN 34 154 808 312 (Australian Financial Services License Number 425376). The information on this website has been prepared from a wide variety of sources, which Kalkine Pty Ltd, to the best of its knowledge and belief, considers accurate. You should make your own enquiries about any investments and we strongly suggest you seek advice before acting upon any recommendation. Kalkine Pty Ltd has made every effort to ensure the reliability of information contained in its newsletters and websites. All information represents our views at the date of publication and may change without notice. To the extent permitted by law, Kalkine Pty Ltd excludes all liability for any loss or damage arising from the use of this website and any information published (including any indirect or consequential loss, any data loss or data corruption). If the law prohibits this exclusion, Kalkine Pty Ltd hereby limits its liability, to the extent permitted by law to the resupply of services. There may be a product disclosure statement or other offer document for the securities and financial products we write about in Kalkine Reports. You should obtain a copy of the product disclosure statement or offer document before making any decision about whether to acquire the security or product. The link to our Terms & Conditions has been provided please go through them and also have a read of the Financial Services Guide. On the date of publishing this report (mentioned on the website), employees and/or associates of Kalkine Pty Ltd do not hold positions in any of the stocks covered on the website. These stocks can change any time and readers of the reports should not consider these stocks as personalised advice.
Past performance is not a reliable indicator of future performance.
 Please wait processing your request...