
Section 1: Company Overview and Fundamentals
1.1 Company Overview:
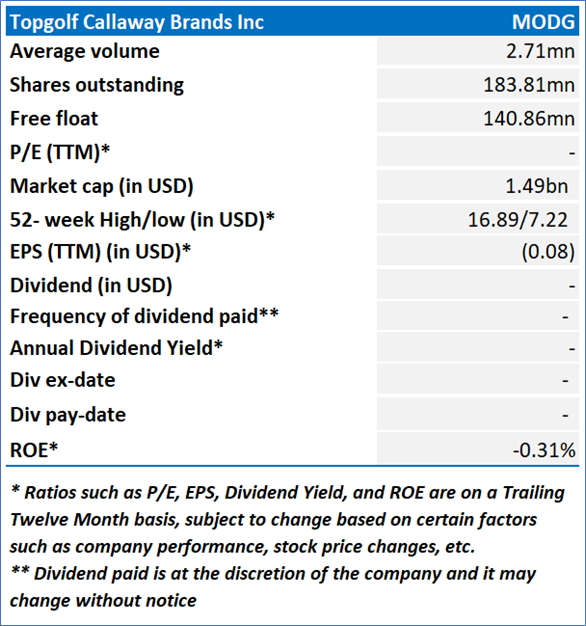
Topgolf Callaway Brands Corp. (NYSE: MODG) is a golf and active lifestyle company. The Company provides golf entertainment experiences, designs, and manufactures golf equipment, and sells golf and active lifestyle apparel and other accessories through its family of brand names, which include Topgolf, Callaway Golf, Odyssey, TravisMathew, Jack Wolfskin, OGIO, Toptracer and World Golf Tour. Its segments include Topgolf, Golf Equipment, and Active Lifestyle.
Kalkine’s Diversified Opportunities Report covers the Company Overview, Key positives & negatives, Investment summary, Key investment metrics, Top 10 shareholding, Business updates and insights into company recent financial results, Key Risks & Outlook, Price performance and technical summary, Target Price, and Recommendation on the stock.
Stock Performance:
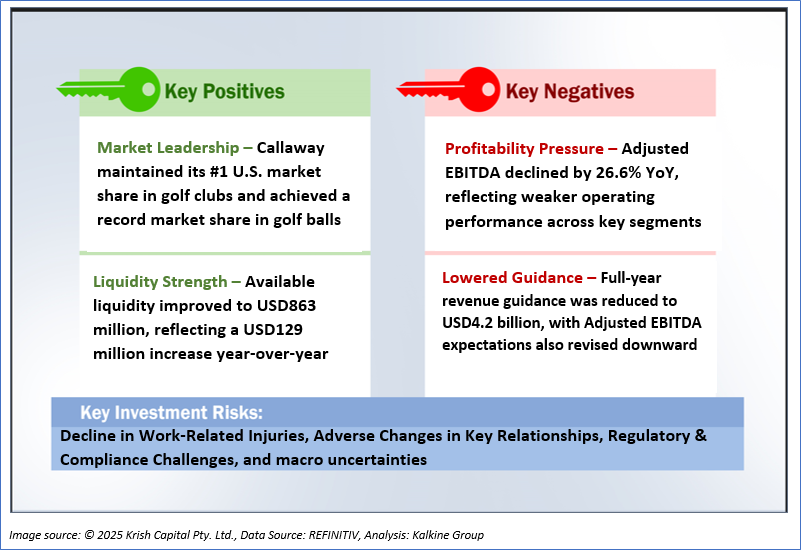
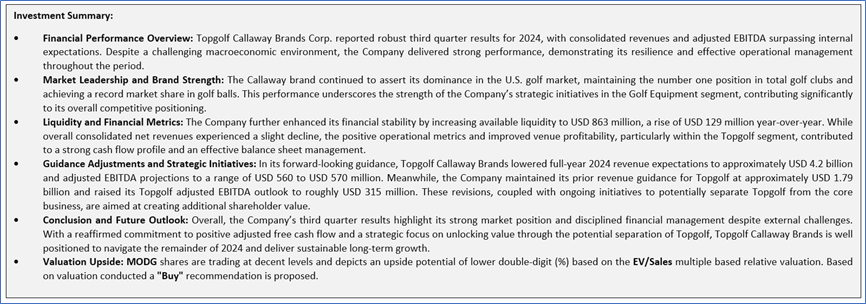
1.2 The Key Positives, Negatives, and Investment summary
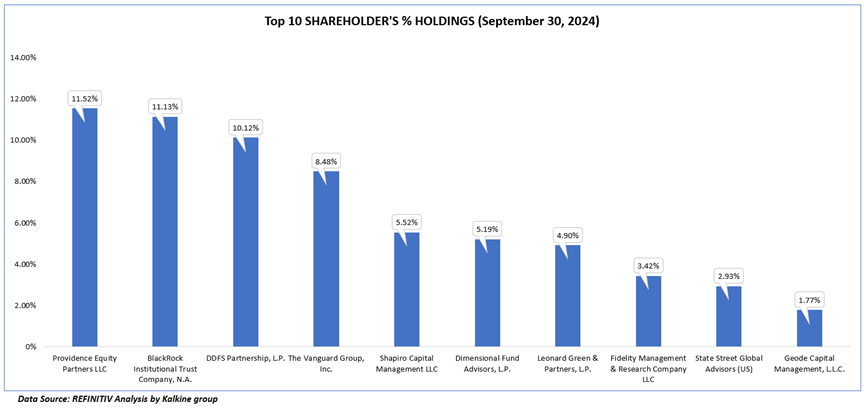
1.3 Top 10 shareholders:
The top 10 shareholders together form ~64.97% of the total shareholding, signifying concentrated shareholding. Providence Equity Partners LLC., and BlackRock Institutional Trust Company, N.A. are the biggest shareholders, holding the maximum stake in the company at 11.52% and 11.13%, respectively.
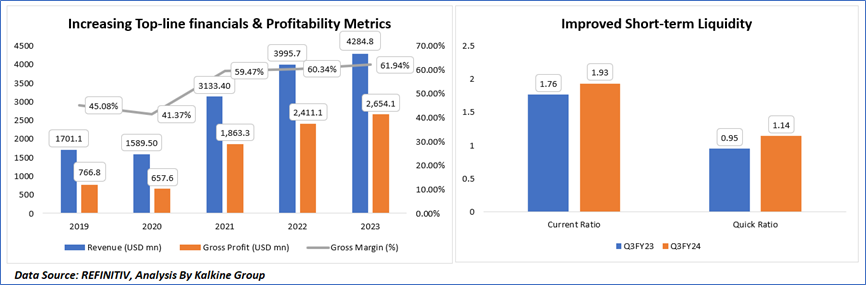
1.4 Key Metrics
The company’s financial performance exhibited significant growth over the past five years. Revenue increased from USD 1,701.1 million in 2019 to USD 4,284.8 million in 2023, reflecting strong top-line expansion. Despite a decline in revenue in 2020, the company rebounded sharply in 2021 and continued its growth trajectory. Gross profit followed a similar trend, rising from USD 766.8 million in 2019 to USD 2,654.1 million in 2023, with an improving gross margin from 45.08% in 2019 to 61.94% in 2023, indicating enhanced operational efficiency and cost management. The company's liquidity position also strengthened, as evident from an increase in the current ratio from 1.76 in Q3FY23 to 1.93 in Q3FY24 and an improvement in the quick ratio from 0.95 to 1.14 over the same period, suggesting a better ability to meet short-term obligations.
Section 2: Business Updates and Corporate Business Highlights
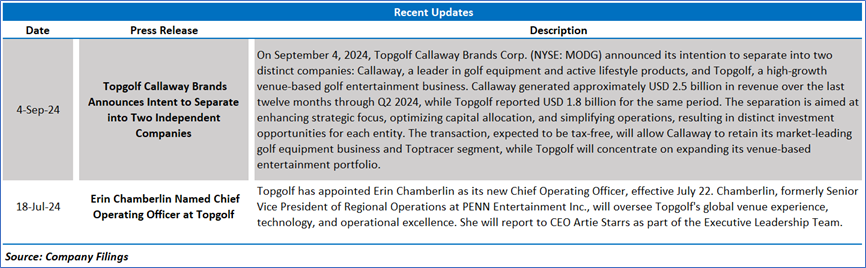
2.1 Recent Updates:
The below picture gives an overview of the recent updates:
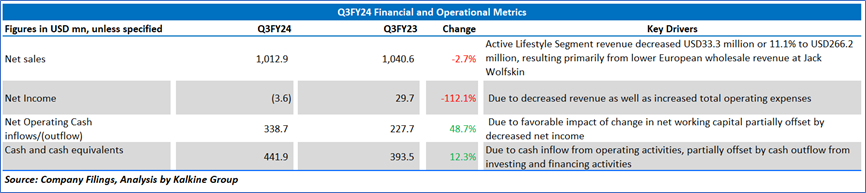
2.2 Insights of Q3FY24:
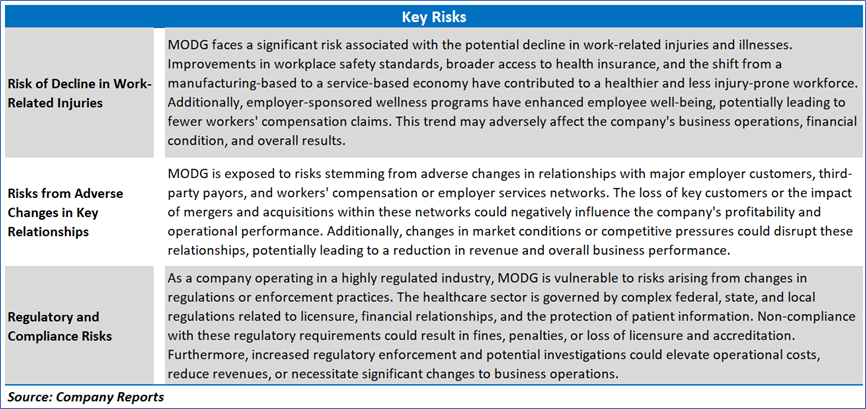
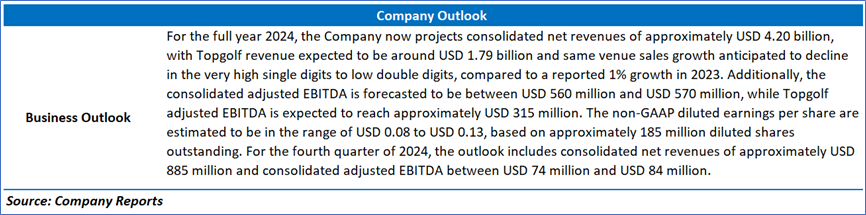
Section 3: Key Risks & Outlook
Section 4: Stock Recommendation Summary:
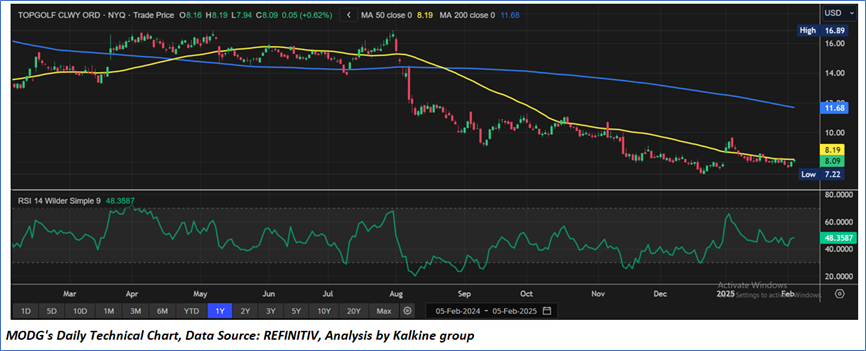
4.1 Price Performance and Technical Summary:
Stock Performance:
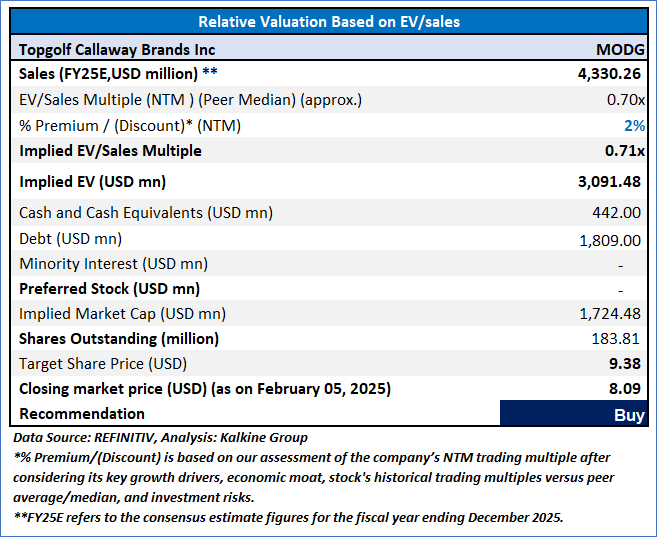
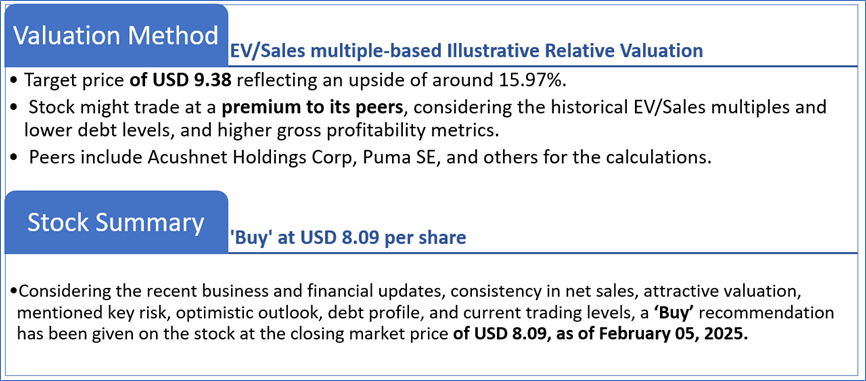
4.2 Fundamental Valuation
Valuation Methodology: EV/Sales Multiple Based Relative Valuation
Markets are trading in a highly volatile zone currently due to certain macroeconomic issues and geopolitical tensions prevailing. Therefore, it is prudent to follow a cautious approach while investing.
Note 1: Past performance is not a reliable indicator of future performance.
Note 2: The reference date for all price data, currency, technical indicators, support, and resistance levels is February 05, 2025. The reference data in this report has been partly sourced from REFINITIV.
Note 3: Investment decisions should be made depending on an individual's appetite for upside potential, risks, holding duration, and any previous holdings. An 'Exit' from the stock can be considered if the Target Price mentioned as per the Valuation and or the technical levels provided has been achieved and is subject to the factors discussed above.
Note 4: The report publishing date is as per the Pacific Time Zone.
Technical Indicators Defined: -
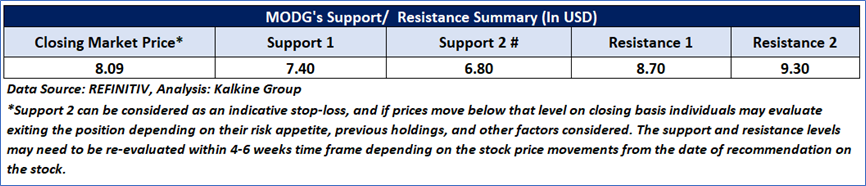
Support: A level at which the stock prices tend to find support if they are falling, and a downtrend may take a pause backed by demand or buying interest. Support 1 refers to the nearby support level for the stock and if the price breaches the level, then Support 2 may act as the crucial support level for the stock.
Resistance: A level at which the stock prices tend to find resistance when they are rising, and an uptrend may take a pause due to profit booking or selling interest. Resistance 1 refers to the nearby resistance level for the stock and if the price surpasses the level, then Resistance 2 may act as the crucial resistance level for the stock.
Stop-loss: It is a level to protect against further losses in case of unfavorable movement in the stock prices.
Past performance is not a reliable indicator of future performance.
 Please wait processing your request...