
Section 1: Kalkine’s Rank on Identified Liquidity Stocks
Kalkine’s Liquidity Stocks ranking report aims to reflect Companies that have strong ability to pay short-term and long-term obligations, have healthy balance sheet and cash flows, across market capitalization. These companies might have positive operating cash flow alongside other metrics defined below.
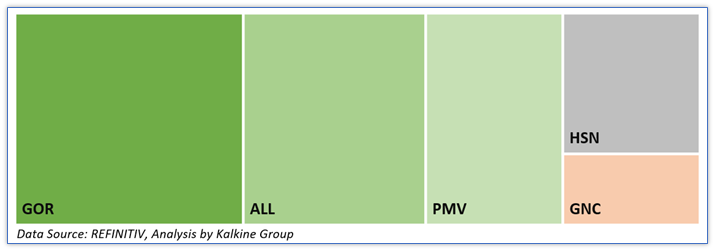
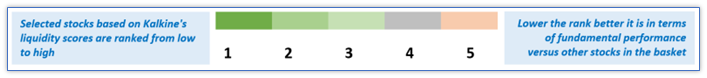
Note: Selected Liquidity Stocks are ranked from low to high using Kalkine’s unique ranking methodology, where-in low rank implies better fundamental metrics performance versus other stocks in the basket. Refer to Section 5 for more details on metrics used in ranking the Liquidity Stocks from low to high.
Section 2: Stock Price Performance, Key Financial and Technical Highlights
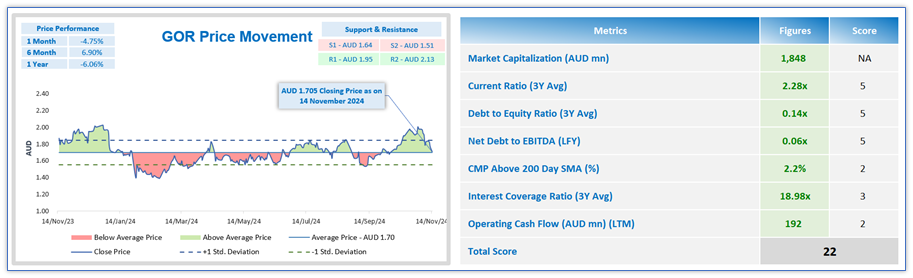
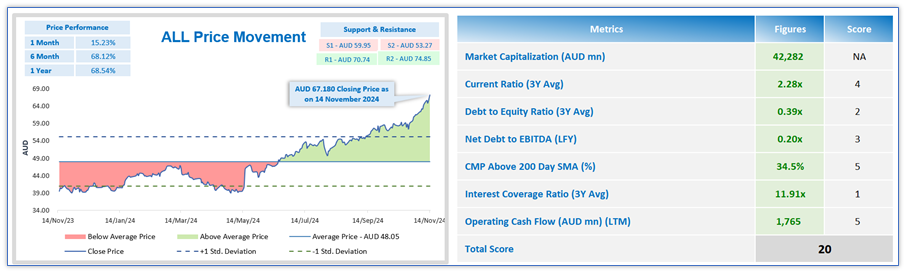
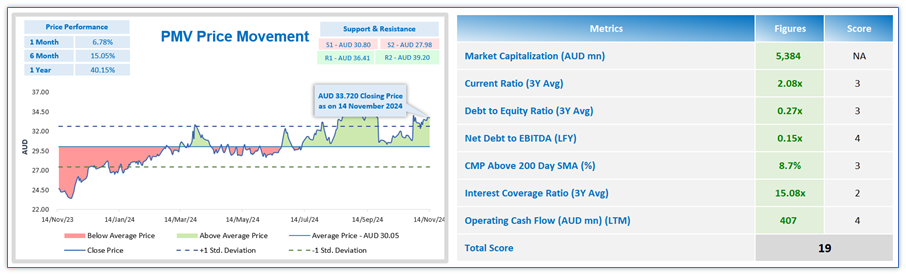
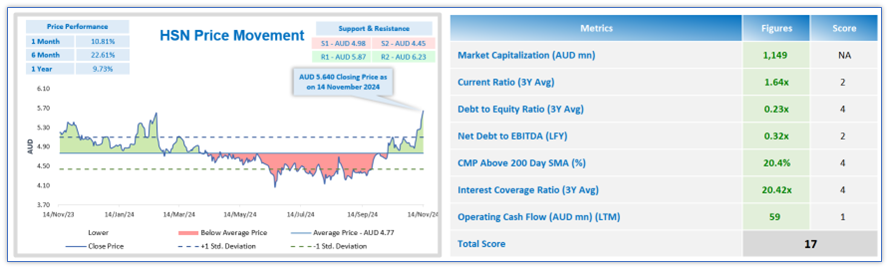
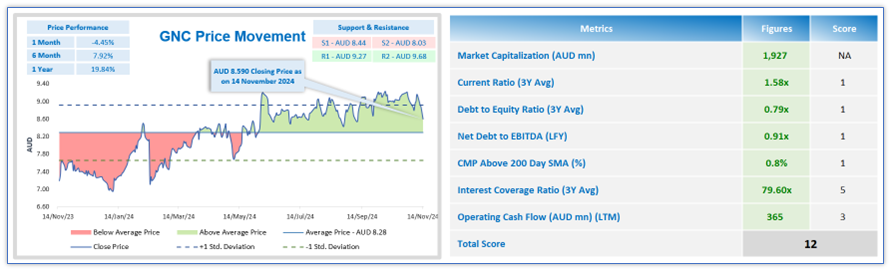
Data Source: REFINITIV; Analysis by Kalkine Group
Note: 3Y Avg = 3 Years Average, 5Y Avg = 5 Years Average, LFY refers to Last Fiscal Year, LTM refers to Last Twelve Months, SMA refers to Simple Moving Average
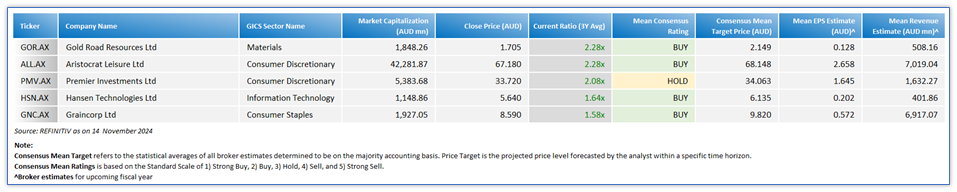
Section 3: Key Broker Consensus Data on Liquidity Stocks
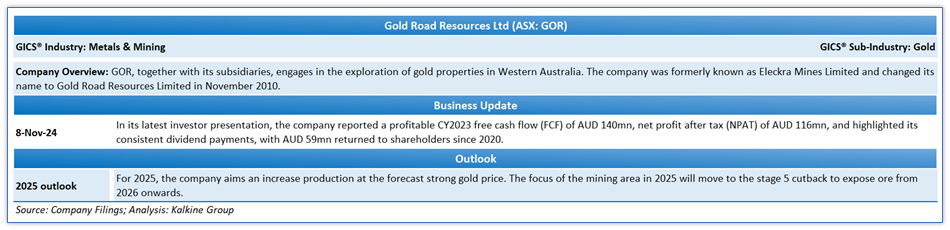
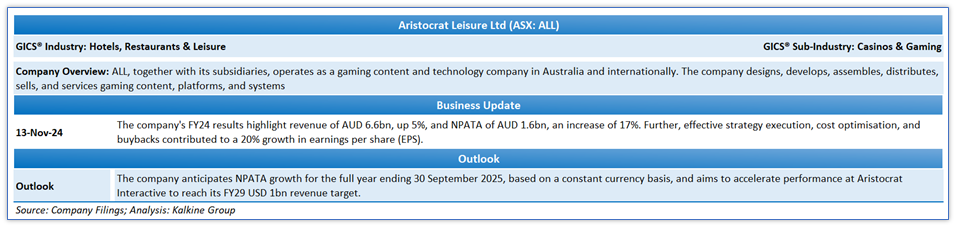
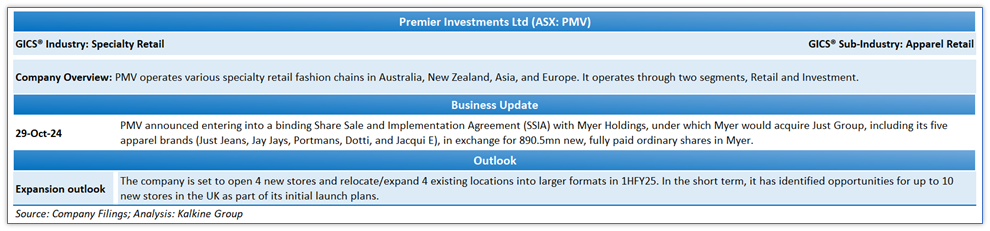
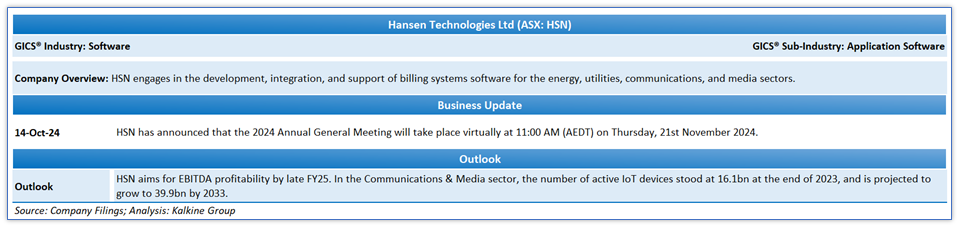
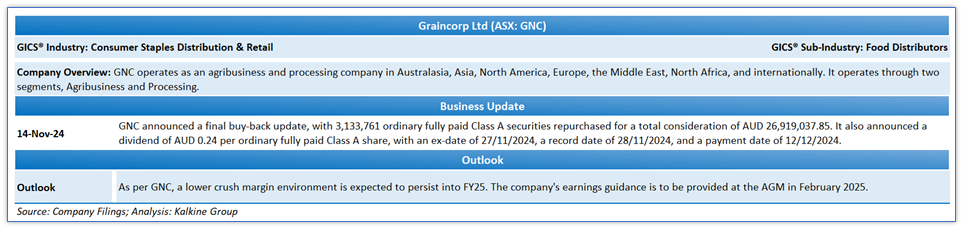
Section 4: Recent Business Updates and Outlook of Liquidity Stocks
Section 5: Kalkine’s Unique Liquidity Stocks Ranking Method
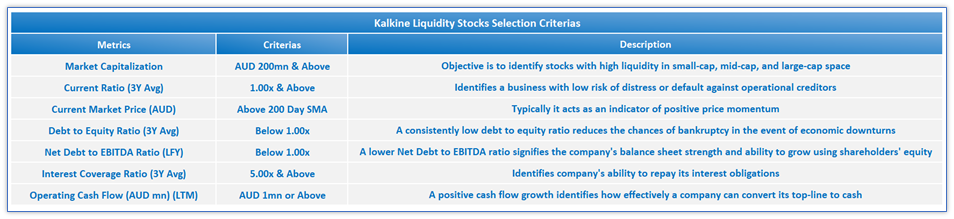
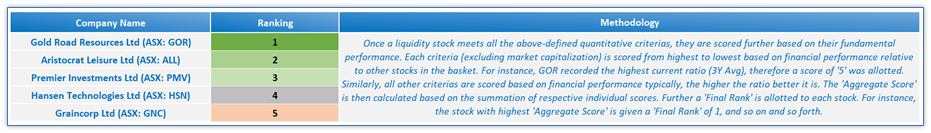
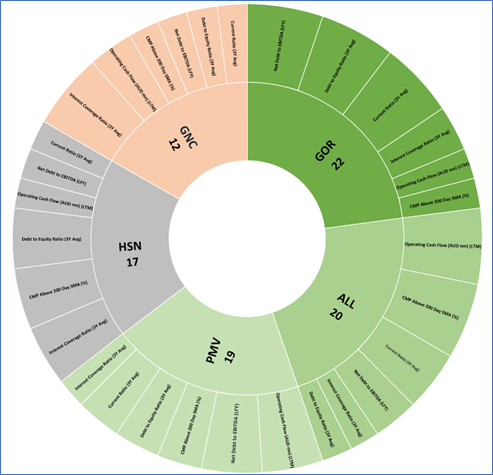
ASX-listed Liquidity Stocks are scored based on the below set of quantitative fundamental criteria’s as per Kalkine’s unique scoring methodology. The objective is to screen the companies with high liquidity and a 3 year average current ratio of 1.00x and above, and operating cash flow of last twelve months over AUD 1mn. Only stocks that scored highest and met the selection criterias based on all the above quantitative fundamental metrics were further scored. The scoring was done among all the screened stocks based on their fundamental performance relative to the stock basket selected.
As a next step, the stocks are ranked from low to high, where-in lower the rank, the better it is, considering the better financial performance versus other stocks identified.
Kalkine’s Liquidity Score Break-Up
Source: Kalkine Group; Copyright © 2024 Krish Capital Pty. Ltd.
Note 1: Past performance is not a reliable indicator of future performance.
Note 2: The reference date for all price data, currency, technical indicators, support, and resistance levels is 14 November 2024. The reference data in this report has been partly sourced from REFINITIV.
Technical Indicators Defined: -
Support: A level at which the stock prices tend to find support if they are falling, and a downtrend may take a pause backed by demand or buying interest. Support 1 refers to the nearby support level for the stock and if the price breaches the level, then Support 2 may act as the crucial support level for the stock.
Resistance: A level at which the stock prices tend to find resistance when they are rising, and an uptrend may take a pause due to profit booking or selling interest. Resistance 1 refers to the nearby resistance level for the stock and if the price surpasses the level, then Resistance 2 may act as the crucial resistance level for the stock.
Past performance is not a reliable indicator of future performance.
 Please wait processing your request...