
Company Overview: The Star Entertainment Group Limited, formerly Echo Entertainment Group Limited, operates in the gaming, entertainment and hospitality industries. The Company owns and operates The Star Sydney (The Star Sydney); Treasury Casino and Hotel, Brisbane (Treasury Brisbane), and Jupiters Hotel and Casino, Gold Coast (Gold Coast). The Company's segments include The Star Sydney, Gold Coast and Treasury Brisbane. The Star Sydney comprises The Star Sydney's casino operations, including hotels, apartment complex, restaurants, bars and night club. The Gold Coast segment includes Jupiters' casino operations, including hotel, theatre, restaurants and bars. The Treasury Brisbane segment includes Treasury's casino operations, including hotel, restaurants and bars. The Company also manages the Gold Coast Convention and Exhibition Centre on behalf of the Queensland Government. The Company also owns Broadbeach Island on which the Gold Coast casino is located..png)
SGR Details
Decent Performance in FY19 Amidst Challenging Market Condition: The Star Entertainment Group Limited (ASX: SGR) is a mid-cap gaming and entertainment company with the market capitalisation of ~$4.27 Bn as of 16 January 2020. The main activities of the group are management of integrated resorts with gaming, entertainment and hospitality services. FY19 results were in line with earnings guidance which was provided in the month of June 2019. The company’s statutory NPAT amounted to $198 million, reflecting a rise of 33.7% on YoY basis (after significant items). Moreover, its statutory earnings before interest, tax, depreciation and amortisation (or EBITDA) rose by 14.1% on FY18 to $553 million (before the significant items). SGR’s statutory results were helped by an actual win rate of 1.38% in International VIP Rebate business as compared to 1.16% in FY18. The company’s portfolio of high-quality tourism, entertainment and gaming assets continued to expand in attractive local destinations of Sydney, the Gold Coast and Brisbane. Additionally, for FY19, the continued expansion was coupled with robust domestic results and reset of the organisational structure to prepare the company for the next stage of growth and development.
Considering the overall business performance, and strength of the company’s balance sheet, the Board of Directors managed to declare final dividend amounting to 10 cps (fully franked), which takes total dividends to 20.5 cps (fully franked). The total dividend amount happens to be in line with FY18 which reflects a payout ratio of 84% of normalised NPAT. The Board of Directors is of the view that organisational changes along with the cost management measures implemented in 2H FY19 will position the company to continue to deliver high-quality results amidst softening macroeconomic environment and some challenging market conditions. Coming to the capital expenditure, the company incurred capex amounting to $320 million in FY19, which reflects a fall of $157 million on YoY basis.
Moving forward, there are expectations that strong balance sheet position, capabilities to convert its top-line into the bottom-line, large attractive markets and competitive capabilities might act as tailwinds for long-term growth. Hence, we have valued the stock using two relative valuation methods, i.e., P/E and Price/Cash flow multiples, and 5-year average P/E market multiples of ~19.46x to FY20E consensus EPS of $0.26 and have arrived at a target price of high single-digit to low double-digit upside (in percentage term). At CMP of $4.72, the stock of the company is trading at P/E multiple of ~17.88x of FY20E EPS..png)
Key Financial Highlights (A$ Mn) (Source: Company Reports, Thomson Reuters)
Key Margins: The company’s gross margin stood at 95.6% in FY19, which is higher than the industry median of 55.4%. Its net margin stood at 9.2%, which is higher than the FY18 figure of 7.1% and, therefore, it can be said that SGR has improved its capabilities to convert its top-line into the bottom-line. Notably, its EBITDA margin stood at 25.5% in FY19, which reflects a rise from FY18 figure of 23.2%.
RoE stood at 5.3% in FY19, which is higher than the FY18 figure of 4.2% and, therefore, it can be said that SGR has been delivering decent returns to its shareholders. The company’s Debt/Equity ratio stood at 0.31x in FY19, which is lower than the industry median of 0.43x and, thus, it looks like SGR’s balance sheet is more stable as compared to the broader industry. Generally, a lower debt on the balance sheet reflects that the company could focus more on its long-term growth objectives. It can be said that higher RoE, decent capabilities to convert its top line into the bottom line and lower Debt/Equity ratio might help the company in gaining traction among the market participants. .png)
Key Metrics (Source: Thomson Reuters)
Update on Trading and Anticipated Earnings: Earlier, the company has issued a release which provides a trading update (unaudited) for July 1 to October 21, 2019, wherein group domestic revenue increased by 1.5% on pcp with growth in Sydney and Queensland. The company has stated that normalised group EBITDA for 1H FY 2020 is anticipated to be in the range of $300 million and $310 million.
With respect to the Gold Coast Tourism Proposal, the Star has provided Queensland Government an investment proposal which creates substantial tourism drivers for Gold Coast that delivers value to the shareholders, and at the same time, create economic value as well as employment growth in the region.
The proposal has three elements, which comprise of commitments around The Star Gold Coast Masterplan, and upgrades and expansions to Gold Coast Convention and Exhibition Centre (GCCEC), and The Sheraton Grand Mirage.
Analysis of Past Performance: Between FY15- FY19, the company’s operating income has witnessed a CAGR of 2.26% and, therefore, it can be said that SGR is possessing decent operational capabilities. Moreover, during the same time frame, its net income has witnessed a CAGR of 3.99%. The following image shows that the company’s domestic revenue has witnessed a CAGR of 5.1% while domestic EBITDA has encountered a CAGR of 6.8% between FY 2014- FY19. Over the period, domestic revenue has seen a continuous upward movement.
.png)
Long-term Domestic Growth (Source: Company Reports)
In a recent presentation, the company stated that its strategy revolves around focusing on returns and there are large attractive markets. The company is possessing competitive capabilities and complementary partners.
Decent Payout Ratio Might Attract Market Players’ Attention: The company stated that interim dividend amounting to 10.5 cps (fully franked) was paid on April 3, 2019. It has also declared a final dividend per share amounting to 10.0 cents (fully franked). Resultantly, full-year dividend totalled to 20.5 cents per share, which is unchanged as compared to pcp and reflects the payout ratio of 84% of normalised NPAT (or 95% of the statutory NPAT) for FY19. The unchanged total dividends reflect confidence with respect to the business as well as strength in the balance sheet. The annual dividend yield of the company is about 3.45% on a five-year average basis (FY15-19). Currently, the annual dividend yield of the company happens to be at 4.41%, which is higher than the industry (Hotels & Entertainment Services) median of 3.06%. This might help SGR to gain traction among the market players. The following image provides a broader overview of the dividends:.png)
3-Year Reported Results (Source: Company Reports)
What To Expect From SGR Moving Forward: The Star Entertainment Group Limited focuses on improving and de-risking the returns throughout the group. The priorities of the company revolve around 1) executing on Centre of Excellence operating model, 2) delivering on investment strategy, 3) managing the competitive environment, and 4) improving capital efficiency. The company annually establishes the financial budget as well as a 5-year plan that underpins the setting of performance targets. It was added that the financial performance is monitored continuously for any sort of variations from the annual financial budgets and market expectations. It is important to note that core business of the company is capable of producing robust cashflow, which allows it to maintain low to moderate levels of debt, and at the same time, allows the shareholders to be paid dividends.
The company’s balance sheet supports the investment plans and the company has a gearing of 1.9x and $1.7 billion of the committed debt facilities.
Valuation Methodologies:
Method 1: P/E Based Valuation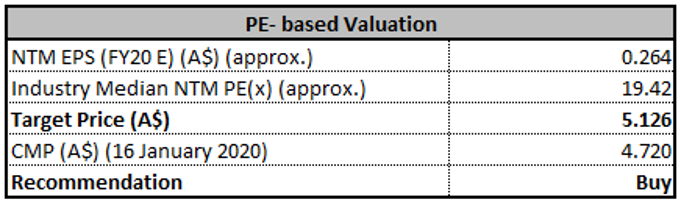
P/E Based Valuation (Source: Thomson Reuters)
Method 2: Price to Cash Flow Based Valuation.png)
Price to Cash Flow Based Valuation (Source: Thomson Reuters)
Method 3: PE Market Multiple Approach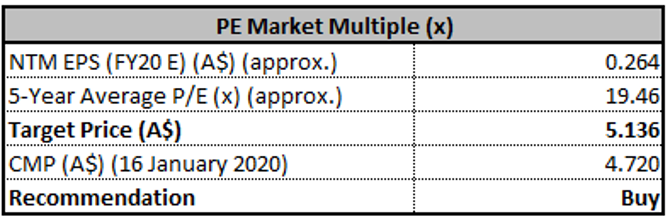
PE Market Multiple Approach (Source: Thomson Reuters)
Note: All the forecasted figures are taken from Thomson Reuters, NTM: Next Twelve Months.png)
Historical PE Band (Source: Thomson Reuters)
Stock Recommendation: The stock of SGR has delivered the return of 13.14% in the span of previous 6 months while in the time span of past three months, there has been a return of 5.44%. The company's objective is to deliver value and returns for its shareholders. The company may adjust the dividends which are to be paid to shareholders, return capital to the shareholders or issue new shares so that capital structure can be maintained or adjusted. Considering the decent outlook, we have valued the stock using two relative valuation methods, i.e., P/E and Price/Cash flow multiples, and 5-year average P/E market multiples of ~19.46x to FY20E consensus EPS of $0.26, and have arrived at a target price of high single-digit to low double-digit upside (in percentage term). Hence, we give a “Buy” recommendation on the stock at the current market price of $4.72 (up 1.505% on 16 January 2020).
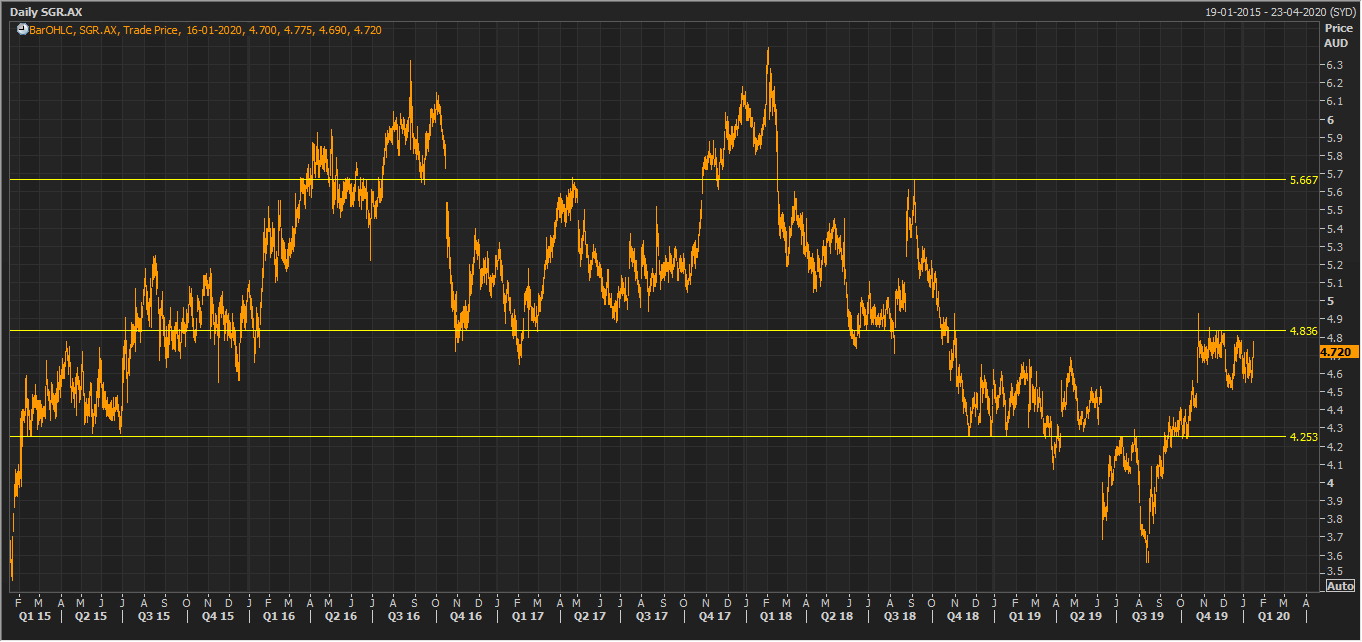
SGR Daily Technical Chart (Source: Thomson Reuters)
Disclaimer
The advice given by Kalkine Pty Ltd and provided on this website is general information only and it does not take into account your investment objectives, financial situation or needs. You should therefore consider whether the advice is appropriate to your investment objectives, financial situation and needs before acting upon it. You should seek advice from a financial adviser, stockbroker or other professional (including taxation and legal advice) as necessary before acting on any advice. Not all investments are appropriate for all people. Kalkine.com.au and associated pages are published by Kalkine Pty Ltd ABN 34 154 808 312 (Australian Financial Services License Number 425376). The information on this website has been prepared from a wide variety of sources, which Kalkine Pty Ltd, to the best of its knowledge and belief, considers accurate. You should make your own enquiries about any investments and we strongly suggest you seek advice before acting upon any recommendation. Kalkine Pty Ltd has made every effort to ensure the reliability of information contained in its newsletters and websites. All information represents our views at the date of publication and may change without notice. To the extent permitted by law, Kalkine Pty Ltd excludes all liability for any loss or damage arising from the use of this website and any information published (including any indirect or consequential loss, any data loss or data corruption). If the law prohibits this exclusion, Kalkine Pty Ltd hereby limits its liability, to the extent permitted by law to the resupply of services. There may be a product disclosure statement or other offer document for the securities and financial products we write about in Kalkine Reports. You should obtain a copy of the product disclosure statement or offer document before making any decision about whether to acquire the security or product. The link to our Terms & Conditions has been provided please go through them and also have a read of the Financial Services Guide. On the date of publishing this report (mentioned on the website), employees and/or associates of Kalkine Pty Ltd do not hold positions in any of the stocks covered on the website. These stocks can change any time and readers of the reports should not consider these stocks as personalised advice.
Past performance is not a reliable indicator of future performance.
 Please wait processing your request...