
Company Overview: The Star Entertainment Group Limited, formerly Echo Entertainment Group Limited, operates in the gaming, entertainment and hospitality industries. The Company owns and operates The Star Sydney (The Star Sydney); Treasury Casino and Hotel, Brisbane (Treasury Brisbane), and Jupiters Hotel and Casino, Gold Coast (Gold Coast). The Company's segments include The Star Sydney, Gold Coast and Treasury Brisbane. The Star Sydney comprises The Star Sydney's casino operations, including hotels, apartment complex, restaurants, bars and night club. The Gold Coast segment includes Jupiters' casino operations, including hotel, theatre, restaurants and bars. The Treasury Brisbane segment includes Treasury's casino operations, including hotel, restaurants and bars. The Company also manages the Gold Coast Convention and Exhibition Centre on behalf of the Queensland Government. The Company also owns Broadbeach Island on which the Gold Coast casino is located.
(19).png)
SGR Details
Decent Performance in FY19: The Star Entertainment Group Limited (ASX: SGR) is primarily engaged in the management of integrated resorts with gaming, entertainment and hospitality services. As of October 3, 2019, the market capitalisation of SGR stood at ~A$4.02 billion. Recently, the company released its results for the year ended June 30, 2019 wherein statutory NPAT amounted to $198.0 million, reflecting a rise of 33.7% against the prior year. The statutory earnings before interest, tax, depreciation and amortisation (EBITDA) rose by 14.1% on the last financial year and stood at $553 million (before significant items). The statutory results were supported by the actual win rate of 1.38% in the International VIP Rebate business as compared to 1.16% in FY18. The robust performance of domestic business, coupled with increase in the International VIP business visitors, happens to be a testament to the investment being made towards the properties and positioning to capitalise on opportunities within both domestic and international tourism markets.
The financial year results for 2019 were in line with that of earnings guidance which was given in the month of June 2019. It was added that the pleasing growth in domestic earnings got offset by the softer International VIP Rebate business results, which witnessed the impacts of the market conditions, even though visitor numbers were up. The company’s Board is of the view that organisational changes and the cost management measures which were implemented in 2H FY19 would be positioning the group to continue to deliver high-quality results in the context of softening the macroeconomic environment and some challenging market conditions, domestically and internationally. Considering the overall business performance, and strength of the company’s balance sheet, the Board has declared the final dividend amounting to 10 cents per share (fully franked), which takes the total dividends for the year to 20.5 cents per share (fully franked). The company stated that the total dividend amount was in line with FY18, and it implies a pay-out ratio of 84% of the normalised NPAT. During FY15-19, bottom-line improved from $169.3 Mn in FY15 to $198.0 Mn in FY19, exhibiting a decent CAGR growth of 4.0%. Based on the foregoing, we have valued the stock using two relative valuation methods, i.e., Price to Cash Flow multiple and EV/EBITDA multiple, and 5-year average P/E market multiples of 19.64x to FY20E consensus EPS of $0.24 and have arrived at a target price upside in the ambit of $4.64 to $4.7 (high single-digit growth (in percentage term)). At CMP of $4.30, the stock of the company is trading at P/E multiple 17.92x of FY20E EPS.
.png)
Key Financial Highlights (A$ Mn) (Source: Company Reports, Thomson Reuters)
Top 10 Shareholders: The following picture provides an overview of the top 10 shareholders in SGR:
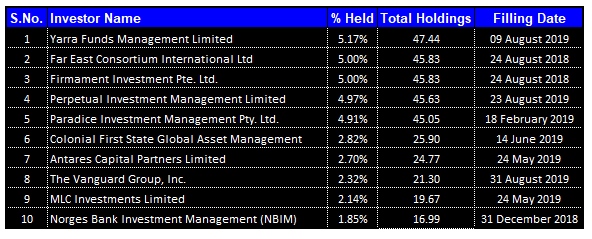
Top 10 Shareholders (Source: Thomson Reuters)
YoY Improvement in Key Margins: The company has witnessed YoY improvement in its key margins in FY19 as its net margin stood at 9.2% as compared to FY18 figure of 7.1% and, thus, it can be said that SGR has improved its capabilities to convert its top-line into the bottom-line. In FY19, the company’s EBITDA margin and operating margin stood at 25.5% and 14.5% as compared to 23.2% and 13.8% in FY18, respectively. RoE stood at 5.3% in FY19 while in FY18 the same was at 4.2% and, thus, it looks like that the company has delivered improved returns to its shareholders which might help it in attracting the attention of the market players. The company’s Debt/Equity ratio stood at 0.31x in FY19 as compared to the industry median of 0.43x and, therefore, it can be said that SGR’s balance sheet is less leveraged as compared to the broader industry. Generally, lower debt on the balance sheet reflects stability, and the company’s focus can be towards its long-term growth strategies.
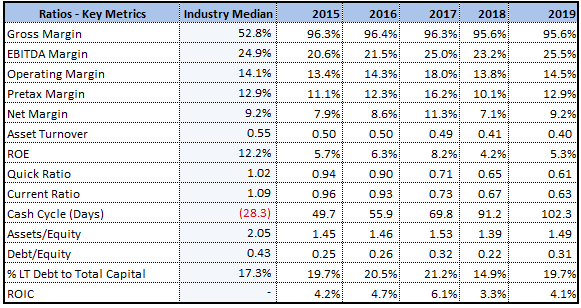
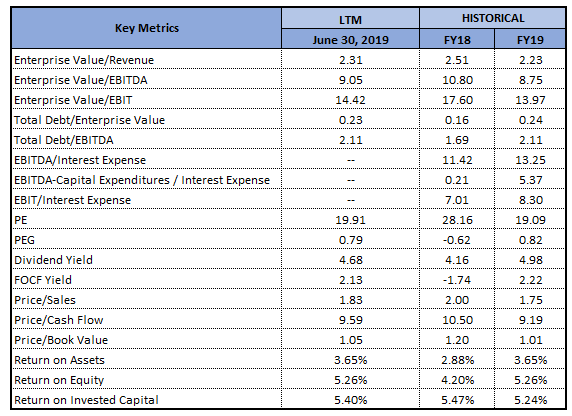
Key Metrics (Source: Thomson Reuters)
Announcement About Vesting of the Executive Performance Rights: The Star Entertainment Group Limited has advised that pursuant to long term incentive plan, no performance rights which were previously granted to various executives for the financial year ended June 30, 2016 have vested because of non-achievement of performance hurdles on testing. The performance rights which have lapsed include 253,456 performance rights granted to MD and CEO following the shareholder approval at the company’s AGM on November 4, 2015. The FY16 grant comprised a 50% earnings per share (or EPS) performance hurdle and a 50% relative total shareholder return (or TSR) performance hurdle.
The EPS hurdle measures growth in statutory earnings per ordinary share adjusted for the theoretical win rate in VIP Rebate business. Further, it stated that the target hurdle of 35.2 cents per share was set by Board by reference to the company’s Board approved 5-year business plan. The threshold hurdle of 33.5 cents per share was set by the Board by reference to market consensus at the time. For FY19, performance of EPS was below the threshold and target approved by the Board. Therefore, none of EPS components of the FY16 award vested.
Overview of Property Performance: With respect to Sydney, it stated that the domestic growth was offset by declines in VIP and the domestic revenue rose by 3.1% on pcp while domestic EBITDA rose by 5% on pcp. Additionally, the operating costs witnessed a fall of 2.9% on the pcp, and a rise in domestic volumes as well as higher wages were offset by lower international gaming volumes. With respect to Queensland, the company stated that there has been continued growth in terms of the normalised and statutory net revenue and EBITDA. It was further added that the slots market share witnessed a rise at Treasury Brisbane and The Star Gold Coast. The operating costs rose by 4.9% on pcp basis, driven by increased domestic and international gaming volumes, higher wages, and newly commissioned assets on the Gold Coast.
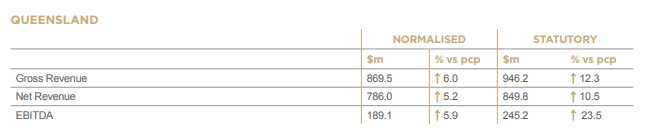
Queensland (Source: Company Reports)
Dividend Yield Higher Than Industry Average: Coming to the dividends, the company has declared a fully-franked final dividend amounting to 10.0 cps which happens to be 92% of the normalised 2H FY19 NPAT. The company’s total dividend for the year amounted to 20.5 cps, which implies 84% of normalised FY19 NPAT. The annual dividend yield of the company is about 3.45% on a five-year average basis (FY15-19). At the current market price of A$4.300 per share, the company’s annual dividend yield stood at 4.68%, which is higher than the industry average (Hotels & Entertainment Services) of 3.5% and, thus, it looks like that SGR has been generating decent income for its shareholders which might attract the attention of dividend-seeking investors. The following picture provides an overview of the dividends per share:
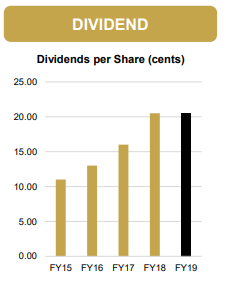
Dividends Per Share (Source: Company Reports)
The company is focused on shareholder returns with the help of strategic positioning, operational leadership, continuous cost management, capital efficiency, and dividend yield. Additionally, the total dividend per share was unchanged from the FY18 record levels, which reflects confidence in business and strength in the balance sheet.
What To Expect From SGR: Looking forward into FY20, the company stated that the focus would be on the key strategic priorities i.e., (1) leveraging Centre of Excellence operating model in order to continue to build on solid PGR member growth and improve main gaming floor (or MGF) performance as well as extract and retain efficiencies, (2) continuing to seek approvals for the proposed construction of The Ritz-Carlton Hotel and Residences in Sydney, (3) managing competitive environment for the Sydney new entrant and Gold Coast market, and (4) continuing to improve capital efficiency, via reduced capital outlook and potential capital recycling of supporting assets.
The company’s priorities also revolve around improving and de-risking the returns throughout the group. SGR plans to deliver on the investment strategy, manage the competitive environment and improve capital efficiency. The group has continued to make progress on the key strategic priorities as it has focused on the shareholder returns via the continuous cost management and the operational leadership in moving to Centres of Excellence model. Since the company has managed to maintain the same levels of total dividends in FY19 as in FY18, it can be said that SGR is focused on providing decent income to the shareholders.
Key Valuation Metrics (Source: Thomson Reuters)
Valuation Methodologies:
Method 1: Price to Cash Flow based Valuation
(14).png)
Price to Cash Flow based Valuation (Source: Thomson Reuters), *NTM: Next Twelve Months
Method 2: EV/EBITDA Valuation Multiple
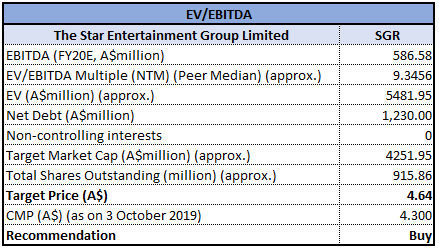
EV/EBITDA Valuation Multiple (Source: Thomson Reuters)
Note: All forecasted figures and peers have been taken from Thomson Reuters, *NTM: Next Twelve Months
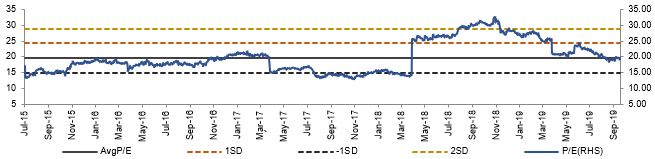
Historical PE Band (Source: Thomson Reuters)
Stock Recommendation: The stock price of SGR has delivered a return of 8.09% in the span of previous one month, while in the time frame of previous three months, the stock rose by 5.76%. The company’s net asset position happens to be in line with that of pcp. The company’s net debt amounted to $972.6 million as compared to June 30, 2018 figure of $678.0 million. On July 3, 2019, the company has refinanced the bank facilities, increasing total facility limit to $1.2 billion as well as average drawn debt maturity to 5.3 years. Additionally, the gearing levels support the investment plans at 1.9 times FY19 net debt to statutory EBITDA. This, along with refinancing the bank facilities in the month of July 2019, places the company well to continue executing on the growth projects.
Considering the above parameters, we have valued the stock using two relative valuation method, i.e., Price to Cash Flow multiple and EV/EBITDA multiple, and 5-year average P/E market multiples of 19.64x to FY20E consensus EPS of $0.24 and have arrived at a target price upside in the ambit of $4.64 to $4.7 (high single-digit growth (in percentage term)). Hence, we give a “Buy” recommendation on the stock at the current market price of A$4.300 per share (down 1.826% on 3 October 2019).
.png)
SGR Daily Technical Chart (Source: Thomson Reuters)
Disclaimer
The advice given by Kalkine Pty Ltd and provided on this website is general information only and it does not take into account your investment objectives, financial situation or needs. You should therefore consider whether the advice is appropriate to your investment objectives, financial situation and needs before acting upon it. You should seek advice from a financial adviser, stockbroker or other professional (including taxation and legal advice) as necessary before acting on any advice. Not all investments are appropriate for all people. Kalkine.com.au and associated pages are published by Kalkine Pty Ltd ABN 34 154 808 312 (Australian Financial Services License Number 425376). The information on this website has been prepared from a wide variety of sources, which Kalkine Pty Ltd, to the best of its knowledge and belief, considers accurate. You should make your own enquiries about any investments and we strongly suggest you seek advice before acting upon any recommendation. Kalkine Pty Ltd has made every effort to ensure the reliability of information contained in its newsletters and websites. All information represents our views at the date of publication and may change without notice. To the extent permitted by law, Kalkine Pty Ltd excludes all liability for any loss or damage arising from the use of this website and any information published (including any indirect or consequential loss, any data loss or data corruption). If the law prohibits this exclusion, Kalkine Pty Ltd hereby limits its liability, to the extent permitted by law to the resupply of services. There may be a product disclosure statement or other offer document for the securities and financial products we write about in Kalkine Reports. You should obtain a copy of the product disclosure statement or offer document before making any decision about whether to acquire the security or product. The link to our Terms & Conditions has been provided please go through them and also have a read of the Financial Services Guide. On the date of publishing this report (mentioned on the website), employees and/or associates of Kalkine Pty Ltd do not hold positions in any of the stocks covered on the website. These stocks can change any time and readers of the reports should not consider these stocks as personalised advice.
Past performance is not a reliable indicator of future performance.
 Please wait processing your request...