
Company Overview: The Star Entertainment Group Limited, formerly Echo Entertainment Group Limited, operates in the gaming, entertainment and hospitality industries. The Company owns and operates The Star Sydney (The Star Sydney); Treasury Casino and Hotel, Brisbane (Treasury Brisbane), and Jupiters Hotel and Casino, Gold Coast (Gold Coast). The Company's segments include The Star Sydney, Gold Coast and Treasury Brisbane. The Star Sydney comprises The Star Sydney's casino operations, including hotels, apartment complex, restaurants, bars and night club. The Gold Coast segment includes Jupiters' casino operations, including hotel, theatre, restaurants and bars. The Treasury Brisbane segment includes Treasury's casino operations, including hotel, restaurants and bars. The Company also manages the Gold Coast Convention and Exhibition Centre on behalf of the Queensland Government. The Company also owns Broadbeach Island on which the Gold Coast casino is located.
.png)
SGR Details
Decent Outlook backed by good financials: The Star Entertainment Group Limited (ASX: SGR) had released its results for 1H FY 2019 wherein it witnessed strong earnings and cash generation. The company’s domestic performance was aided by high quality and broad-based growth and the execution on its effective growth strategy. The company has gearing at 1.3 times Net Debt/ Statutory 12-month company’s EBITDA, and this signifies its ability to support planned investments. The company’s trailing EBITDA which reflects that the interim dividend witnessed the rise of 40.0% on pcp and stood at 10.5 cents per share (fully franked) demonstrates the positive business momentum and higher dividend pay-out policy. The company’s management stated that they are delivering continued growth with respect to its key segments of the business and they are exhibiting effective management of the capital expenditure. The future optimism is supported by the existing and new customers which are responding favourably to newly unveiled attractions. The company’s statutory gross revenue and statutory EBITDA got supported by the high actual win rate in International VIP rebate business. SGR’s operating costs witnessed the rise of 0.3% on pcp and domestic volume growth, increased wages and higher interim service levels were offset by the lower International VIP Rebate volumes as well as continuing management of costs. The company has witnessed a CAGR growth of ~8.17% in its top-line in the span of five years to FY 2018 (FY 2014-FY 2018) while the bottom line CAGR growth came in at ~8.64% during the same period which might consider decent growth over the period. Also, the company is expected to be aided by conservative gearing which might increase traction among the market players. At CMP of $4.48, the stock of the company is trading at P/E multiple 15.34x of FY20E EPS. Seeking the long-term potential into the business, we have valued the stock using the two Relative valuation methods, P/E and EV/Sales and the five-year average P/E of 19.32x for FY20E with the consensus EPS of $0.29 and have arrived at the target price in the ambit of $4.8-$5.6 (lower double-digit (in %)). Key Risks related to rating: regulatory risk, geo-political changes which affect the operation of Casinos, uncertainty on consumer spending, and intense competition in the key market of Sydney, Brisbane, and the Gold Coast, etc.
.png)
Key Financial Metrics (Source: Company Reports, Thomson Reuters)
Top 10 Shareholders: The following table gives the broad overview of the top 10 shareholders in The Star Entertainment Group and the first position in being bagged by Perpetual Investment Management Limited which is holding 10.58% stake of total shareholdings.
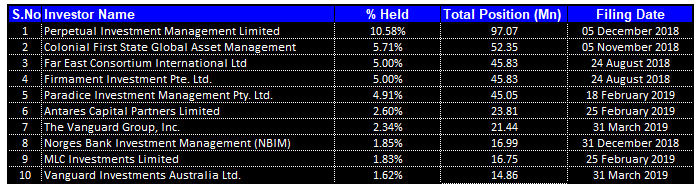
Top 10 Shareholders (Source: Thomson Reuters)
Decent Margin Position and Deleveraging of Balance Sheet: The Star Entertainment Group Limited possesses a decent position with respect to its key margins as its net margin stood at 12.9% in 1H FY 2019 which is higher than the industry median of 10.1% demonstrating that the company’s capability to convert its top line into the bottom line. Its operating margin witnessed an improvement of 8.8% on the YoY basis in 1H FY 2019 and stood at 19.6% which highlights its cost-effective strategies. The company has registered average RoE of 3.9% in the past 3.5 years and has now improved it to 3.9% in 1HFY19. RoIC too has improved from an average of 2.4% to 3.1% over the said period of time. In 1H FY 2019, the D/E ratio of SGR witnessed a fall of 32.8% on the YoY basis and stood at 0.26x reflecting the deleveraging of its balance sheet. The strengthened balance sheet of SGR might help the company in tacking the short-term challenges and can further improve its financial footing.
.png)
Key Ratio Metrics (Source: Thomson Reuters)
Sydney Witnessed Rise in Slots and Table Revenues: The statutory gross revenue of the Sydney business witnessed a decline of 7.3% in pcp while the statutory EBITDA was up 59.0% on pcp helped by the higher win rate with respect to International VIP rebate business vs pcp. The slots revenue encountered a rise of 9.9% on pcp and the table revenues were up 4.9% on pcp, aided by the robust growth in the private gaming room. The operating costs of Sydney business were down by 3.9% on pcp on increased domestic volumes and higher wages which were offset by the lesser international gaming volumes. The International VIP rebate business front money witnessed a decline of 20.0% on pcp and the turnover was down 49.0% impacted by the low turn of 9.2 times.
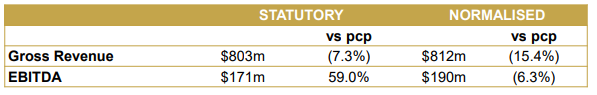
Sydney Business (Source: Company Reports)
Analysing SGR’s Queensland Business: The business of Queensland posted strong statutory and normalised gross revenue and EBITDA wherein all business segments contributed to the growth. The statutory gross revenue witnessed a rise of 31.3% on pcp while the statutory EBITDA rose 74.0%. The normalised gross revenue rose by 16.1% on pcp while the normalised EBITDA grew by 23.5%. The International VIP rebate business win rate stood at 2.32% which helped growth in statutory gross revenue and EBITDA. The non-gaming revenues rose by 5.8% on pcp. The positive response by the guests to the investments which have been recently wrapped up at the Gold Coast is continuing and there was encouraging domestic and international performance as there was a rise of 11.8% on pcp in the visitation, gaining electronic gaming market share, and increased 90.9% turnover of the International VIP rebate business on pcp basis.
.png)
Queensland Business (Source: Company Reports)
Margins Maintained in International VIP Rebate Business: The business witnessed the solid sales performance in International VIP Rebate Business which helped in delivering growth of 10% in the unique patron visitation. The actual revenue witnessed the rise of 2.5% on the pcp and was helped by high win rate. However, the normalised revenue fell by 33.0% on the pcp basis weighed by the low turns. Moreover, the normalised EBITDA margins were in line with the long-term averages even though there were lower volumes.
.png)
Win Rate And Turns, 1H FY 2014 to 1H FY 2019 (Source: Company Reports)
Significant Rise in Dividends Reflects Balance Sheet Strength: The Star Entertainment Group made an announcement of fully franked interim dividend amounting to 10.5 cps which implies a rise of 40% on pcp which reflects the strong business performance, planned investments, and the cash generation. This interim dividend equates to the pay-out ratio of 78% of normalised NPAT and 65% of the statutory NPAT.
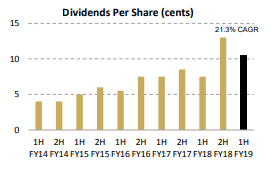
Dividend Per Share (Cents) (Source: Company Reports)
The company is focused towards the shareholder returns and intends to continue the cost management which might help in improving the earnings base moving forward. As of now, the company focuses on increasing the dividends which might attract the traction of market participants moving forward. As evident from the cash flow statement of FY 2018, the company is having robust cash-generating capabilities which might help in building its cash position, thus, helping the liquidity standing.
What To Expect From SGR: The Star Entertainment Group had stated that there have been positive domestic revenue growth trends into early 2H FY 2019 from 1H FY2019 across the slots, tables, and non-gaming. The capital expenditure in 1H FY 2019, excluding joint venture contributions, amounted to $166 million reflecting a fall of $116 million on pcp as the capital works got completed. Further, the company is expecting capex in the range of $300 million-$350 million in FY 2019. Additionally, the company made the contribution to $41 million to the joint venture projects and there are expectations that in FY 2019 it would be between $100 million-125 million.
Moreover, the construction of first joint venture tower has started, and the completion has been scheduled for FY2022. Also, the Queen’s Wharf Brisbane project happens to be on time and budget. The company is focused on the execution of a long-standing strategy of making deployments in the privileged assets to drive the visitation as well as earnings. The priorities of management revolve around the execution i.e. improving the earnings, delivering on next stage of capital plans, commercialisation of the expanded joint venture with Hong Kong-based partners Chow Tai Fook Enterprises and Far East Consortium, as well as fully implementing the enhanced operating model.
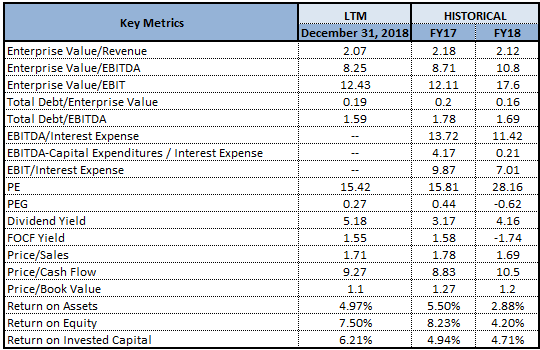
Key Valuation Metrics (Source: Thomson Reuters)
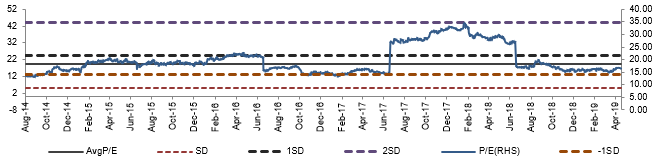
Historical P/E Band (Source: Company Reports)
Stock Recommendation: The stock of SGR has delivered the return of 2.48% in the span of the previous three months, while in the time frame of past one month, the stock posted a decent return of 8.61%. The company has been executing its growth strategy and it also witnessed effective management of capital projects which attract the attention of market players. It reported a higher dividend yield of 5.18% as compared to the Hotels and Entertainment Services industry median of 3.3% representing more income for its shareholders. Going forth, the company is expected to be supported by the strong cash-generating capabilities (evident from FY 2018 cash flow statement), good earnings to meet the net debt obligations, respectable dividend yields and healthy balance sheet. Therefore, considering the strong balance sheet, decent dividend pay-out ratio and focuses on improving the returns across the company as well as delivering the next stage of capital plans, we have valued the stock using the two Relative valuation methods, P/E and EV/Sales and the five-year average P/E of 19.32x for FY20E with the consensus EPS of $0.29 and have arrived at the target price in the ambit of $4.8-$5.6 (lower double-digit (in %)). Based on the foregoing, we give a “Buy” recommendation on the stock at the current market price of A$4.480 per share (down 1.322% on 2 May 2019).
.png)
SGR Daily Chart (Source: Thomson Reuters)
Disclaimer
The advice given by Kalkine Pty Ltd and provided on this website is general information only and it does not take into account your investment objectives, financial situation or needs. You should therefore consider whether the advice is appropriate to your investment objectives, financial situation and needs before acting upon it. You should seek advice from a financial adviser, stockbroker or other professional (including taxation and legal advice) as necessary before acting on any advice. Not all investments are appropriate for all people. Kalkine.com.au and associated pages are published by Kalkine Pty Ltd ABN 34 154 808 312 (Australian Financial Services License Number 425376). The information on this website has been prepared from a wide variety of sources, which Kalkine Pty Ltd, to the best of its knowledge and belief, considers accurate. You should make your own enquiries about any investments and we strongly suggest you seek advice before acting upon any recommendation. Kalkine Pty Ltd has made every effort to ensure the reliability of information contained in its newsletters and websites. All information represents our views at the date of publication and may change without notice. To the extent permitted by law, Kalkine Pty Ltd excludes all liability for any loss or damage arising from the use of this website and any information published (including any indirect or consequential loss, any data loss or data corruption). If the law prohibits this exclusion, Kalkine Pty Ltd hereby limits its liability, to the extent permitted by law to the resupply of services. There may be a product disclosure statement or other offer document for the securities and financial products we write about in Kalkine Reports. You should obtain a copy of the product disclosure statement or offer document before making any decision about whether to acquire the security or product. The link to our Terms & Conditions has been provided please go through them and also have a read of the Financial Services Guide. On the date of publishing this report (mentioned on the website), employees and/or associates of Kalkine Pty Ltd do not hold positions in any of the stocks covered on the website. These stocks can change any time and readers of the reports should not consider these stocks as personalised advice.
Past performance is not a reliable indicator of future performance.
 Please wait processing your request...