Kalkine has a fully transformed New Avatar.

Company Overview: Telstra Corporation Limited (Telstra) is a telecommunications and technology company. Its principal activity is to provide telecommunications and information services for domestic and international customers. The Company operates through four segments. The Telstra Retail segment provides telecommunication products, services and solutions across mobiles, fixed and mobile broadband, telephony and Pay television/Internet Protocol television and digital content. The Global Enterprise and Services segment provides sales and contract management for business and government customers. Telstra Operations segment offers overall planning, design, engineering and architecture and construction of Telstra networks, technology and information technology solution. Telstra Wholesale segment provides a range of telecommunication products and services delivered over Telstra networks and associated support systems to other carriers, carriage service providers and Internet service providers.
.png)
TLS Details
Broadly in-Line 1HFY19 Performance Despite Sectorial Headwinds: Telstra Corporation Limited (ASX: TLS) posted results for 1H FY19 which were broadly in-line with expectation and it demonstrated continued growth with respect to mobile services. During the same period, the company added 240,000 net retail mobile services across the retail postpaid, Internet of Things, prepaid handheld, and mobile broadband. The company also added 125,000 wholesale services which bring the total wholesale services for the company to 1.1 million at the end of 1H FY19. Additionally, the company has been progressing well from the cost reduction program perspective as, in 1H FY 2019, it has managed to reduce 4.2% or $162 million in underlying fixed cost. Since FY 2016, the company witnessed approximately $900 million in cost reduction. We believe that the company’s focus towards the cost reduction program would support the bottom line and it might act as a long-term growth catalyst. The company is on track to achieve the $2.5 billion target of cost reduction. Also, the company expects that FY19 total costs would be broadly flat as compared to FY 2018 (excluding the restructuring costs). As a part of the capital management, for 1HFY19, gross and net debt were flat on a Y-o-Y basis but surged by almost $1 Bn since 30 June 2018 because of seasonality and lower free cash flow. It indicates that the management remains committed to retaining its balance sheet settings consistent with an “A” band credit rating. Managing cash burn is now expected to relate to volume growth in the long-run. Even if competitive intensity remains high, Telstra with its manageable debt, healthy spectrum footprint, and rollout of 5G is well poised for further growth. Seeking the long-term potential in the company, we have valued the stock using the two Relative valuation methods, P/E and EV/Sales and 1-standard deviation to five-year average P/E of 14.2x for FY20E with consensus EPS of around $0.23 and have arrived at target price upside of about single-digit growth (in %). Key Risks related to rating include regulations, the impact of nbn network, data security risk, highly competitive market, softened demand for fixed line, saturation in the Australian mobile market, etc.
.png)
Key Financial Metrics (Source: Company Report, Thomson Reuters)
Decent Margins in 1HFY19: The company happens to possess a decent position as its key margins are higher than the industry median, building further confidence in the company’s business strategies. At the end of December 2018, the company’s net margin stood at 9.8% which is higher than industry median of 8.1% demonstrating the better capability as compared to broader industry to turn the top line into the bottom line. Also, during the same period, the company’s gross margin stood at 65.2% which is comfortably higher than the industry median of 51.7%. The company is also having a decent standing from the liquidity standpoint as is evident from its current ratio of 0.92x (at the end of December 2018), reflecting YoY improvement of 12.3% which positions the company to manage short-term commitments. Therefore, we expect that TLS is poised to witness growth, over the long-term, which would be backed by its focus on reducing costs and T-22 strategy which is placing it in a strong position to tap the future opportunities. Moreover, the company is having an annual dividend yield of 3.99% which is higher than the industry median of 2.1% further demonstrating that the company’s focus on delivering returns to shareholders.
.png)
Margins Trend (Source: Company Report, Thomson Reuters)
Amidst Challenges, Green Shoot Visible: In 1H FY19, TLS posted total income amounting to $13.8 billion on a reported basis which implies a fall of 4.1% and its EBITDA amounted to $4.3 billion which reflects 16.4% fall. The company’s NPAT amounted to $1.2 billion in 1H FY19 reflecting the fall of 27.4%. The company’s financial results were weighed by a further rollout of nbn™ network, with around 55% of premises now connected. However, excluding nbn and in the context of current market dynamics, the company’s underlying business had performed well.
The top management of the company had stated that even though 1H FY19 results demonstrate parts of the business which face short-term challenges, there happen to be some positive signs especially with the significant rise in the retail postpaid mobile services. With the onset of the 5G, the management expects that there could be positive ARPU influences throughout the industry from uptake and new services. Also, there are expectations of some improvement when it comes to nbn wholesale prices.
Progressing Well on T22 Strategy: The management is very optimistic about T22 strategy as they added that it has been enabling the business to reap the benefits of future opportunities. The company’s T22 strategy was designed to accelerate the rate of change, leverage investments that have been making and lifting the level of aspiration in delivering the simpler, more flexible products and services with great digital service experience for the customers. This strategy will strengthen its position in the 2020’s and beyond on the back of upcoming opportunities in relation to growing demand, change in technology, and 5G arrival. Almost half a million Telstra mobile customers are availing benefits of Peace of Mind data plans which was rolled out in July. Telstra’s small business customers have been benefitting from the new bundles which rolled out in October and Telstra Platinum for Business which was rolled out in November. These new solutions give flexibility for the businesses to scale as well as choose what is right. The company’s strategy is built on a foundation of up to $3 billion strategic investment program which is creating the networks for future and digitizing TLS’ business. So far, $2.6 billion has been deployed, and the program would be largely complete by FY 2019 end.
Interim Dividend Consistent with Capital Management Framework: Based on decent performance in 1HFY19 amidst challenges, the Board of Directors declared its fully franked interim dividend of 5 cents per share and fully franked special dividend of 3 cents per share. This summarized a total dividend payment of 8 cents per share for the period of six months and it will be payable on 29 March 2019 with the record date of 28 February 2019. This happens to be consistent with the capital management framework and dividend policy which focuses on paying fully-franked ordinary dividend in the range of 70%-90% of the underlying earnings and return in order of 75% of the net one-off nbn™ receipts to shareholders over time through fully-franked special dividends. The annual dividend yield of the company is about 6.0% on a five-year average basis (FY14-18). Hence, we expect that the company will be able to maintain its dividend yield of more than 5.0% and dividend payout policy in the range of 70% to 90% of the underlying earnings in future.
.png)
Dividends (Source: Company Reports)
Focused on Reducing Whole of Cost Base: The company is maintaining its focus towards sales cost, fixed costs labour, and non-direct labour as well as D&A which also includes capex and asset life reviews. More than half of the fixed costs happen to be direct labour and the company is targeting reduction in the labour costs by around $1.5 billion by FY 2022 from FY 2018. Additionally, in FY19, there are expectations that the total operating expenses excluding the restructuring costs would be broadly flat with the reductions in the underlying fixed to offset higher nbn™ network payments and other variable costs. There would be an acceleration in the fixed cost reduction in 2H FY19 and into FY20. This move will result into cost optimization and utilization of assets to ensure long-term growth.
. .png)
1HFY19 Operating Expenses (Source: Company Reports)
How Could Telstra Perform Moving Forward: In FY 2019, there are expectations that the company would be posting total income between $26.2 billion-$28.1 billion while the EBITDA (excluding the restructuring costs) would be between $8.7 billion-$9.4 billion. As regards expectations of other key metrics, the company’s capital expenditure would be in the range of $3.9 billion-$4.4 billion and the free cash flow would be in the range of $3.1 billion-$3.6 billion. However, the company’s free cash flow would be at the lower end of the guidance primarily because the cash CapEx would rise as the company takes advantage of opportunities in enterprise and wholesale fibre markets and, secondly, the cash redundancies would be higher as TLS accelerates productivity.
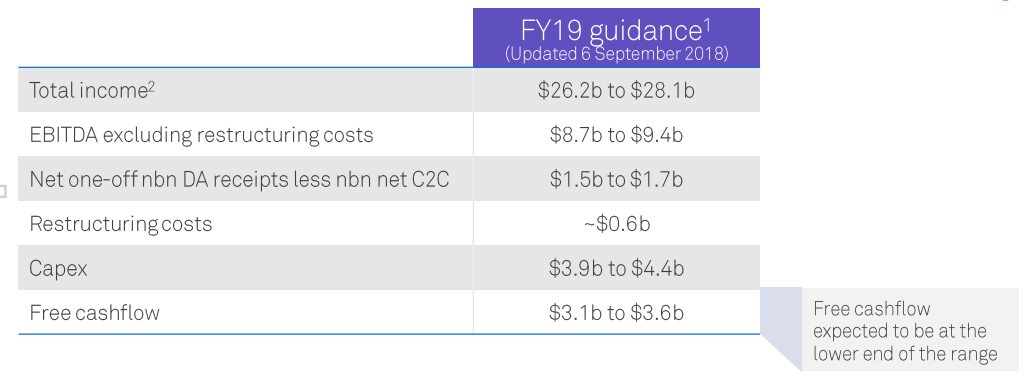
FY 2019 Guidance (Source: Company Reports)
Moreover, the top management added that, presently, there has been a challenging time because of higher competition in the mobile market and the company also feels the unique impact of the transition to nbn. There are expectations that these factors would be weighing over the company’s revenue over the short-term.
.png)
Historical PE Band (Source: Company Reports)
Stock Recommendation: On the monthly chart of Telstra Corporation, Moving Average Convergence Divergence or MACD has been applied and default values were used for the purposes. After careful observation, it was noted that the MACD line has crossed the signal line and had moved in an upward direction after crossover which reflects the bullishness. Therefore, there are expectations that the company’s stock price might rise moving forward. On the other hand, the company is expected to be aided by its T-22 strategy and by its commitment towards the reduction of the expenses which will support decent growth in years to come. Also, another factor which might attract the attention of market players is that the company’s 1H FY19 interim dividend happens to be consistent with the capital management framework and the dividend policy even though the financial results were weighed by further nbn™ network roll out. The company is also facing intense competition.
Managing cash burn is now expected to relate to volume growth in the long-run. Even if competitive intensity remains high, Telstra with its manageable debt, healthy spectrum footprint, and rollout of 5G is well poised for future momentum. Seeking the long-term potential in the company, we have valued the stock using the two Relative valuation methods, P/E and EV/Sales and 1-standard deviation to five-year average P/E of 14.2x for FY20E with consensus EPS of around $0.23 and have arrived at target price upside of about single-digit growth (in %). Hence, we have a “Buy” recommendation on the stock at the current market price of A$3.130 per share.
.png)
TLS Daily Chart (Source: Thomson Reuters)
Disclaimer
The advice given by Kalkine Pty Ltd and provided on this website is general information only and it does not take into account your investment objectives, financial situation or needs. You should therefore consider whether the advice is appropriate to your investment objectives, financial situation and needs before acting upon it. You should seek advice from a financial adviser, stockbroker or other professional (including taxation and legal advice) as necessary before acting on any advice. Not all investments are appropriate for all people. Kalkine.com.au and associated pages are published by Kalkine Pty Ltd ABN 34 154 808 312 (Australian Financial Services License Number 425376). The information on this website has been prepared from a wide variety of sources, which Kalkine Pty Ltd, to the best of its knowledge and belief, considers accurate. You should make your own enquiries about any investments and we strongly suggest you seek advice before acting upon any recommendation. Kalkine Pty Ltd has made every effort to ensure the reliability of information contained in its newsletters and websites. All information represents our views at the date of publication and may change without notice. To the extent permitted by law, Kalkine Pty Ltd excludes all liability for any loss or damage arising from the use of this website and any information published (including any indirect or consequential loss, any data loss or data corruption). If the law prohibits this exclusion, Kalkine Pty Ltd hereby limits its liability, to the extent permitted by law to the resupply of services. There may be a product disclosure statement or other offer document for the securities and financial products we write about in Kalkine Reports. You should obtain a copy of the product disclosure statement or offer document before making any decision about whether to acquire the security or product. The link to our Terms & Conditions has been provided please go through them and also have a read of the Financial Services Guide. On the date of publishing this report (mentioned on the website), employees and/or associates of Kalkine Pty Ltd do not hold positions in any of the stocks covered on the website. These stocks can change any time and readers of the reports should not consider these stocks as personalised advice.
 Please wait processing your request...