Company Overview - Suncorp Group Limited is engaged in the provision of general insurance, banking, life insurance, superannuation products and related services to the retail, corporate and commercial sectors in Australia and New Zealand. The Company's segments include Personal Insurance, Commercial Insurance, General Insurance New Zealand, Banking and Life. Personal Insurance segment offers home and contents insurance, motor insurance, boat insurance and travel insurance. Commercial Insurance segment offers commercial property insurance, marine insurance and workers compensation insurance. General Insurance New Zealand segment offers business insurance, construction and engineering insurance, and public liability and professional indemnity. Banking segment offers personal and commercial banking, agribusiness, property and equipment finance, home, personal and small business loans. Life segment offers life insurance products, superannuation administration services and funds administration services.
.png)
FY15 performance impacted by the General Insurance performance:
Suncorp Group Ltd (ASX: SUN) reported that its profit after tax from business lines fell by 7.1% year on year (yoy) to $1,235 million impacted by the poor performance of its general insurance business. The group’s general insurance NPAT fell to $756 million during the period, against $1,010 million in FY14, as the business witnessed a severe financial impact due to the unexpected natural hazard events. The general insurance business was impacted by a major Brisbane storm in November 2014 as well as Cyclone Marcia and two major events in New South Wales during April and May of 2015. Accordingly, the business incurred over $650 million costs due to five major weather events in Queensland and New South Wales, leading to a reserve release of $427 million, much above the long-run estimation of 1.5% of net earned premium (NEP), due to higher long-tail claims management. On the other hand, the group reported a 55.2% yoy rise in its net profit after tax (NPAT) to $1,133 million in the fiscal year of 2015, driven by bank and Life business as well as cost optimization efforts. SUN improved statutory return on average shareholders’ equity to 8.5% as compared to the 5.3% in fiscal year of 2014 but its cash return on average shareholders’ equity fell to 8.9% during the period against 9.4% prior corresponding period (pcp). Suncorp slightly improved its total ordinary dividends to 76 cents per share fully franked against 75 cents in FY14 and declared a special dividend of 12 cents per share fully franked. The group increased its Bank Common Equity Tier 1 (CET1) capital ratio to 9.15%, to comply with the recent CET1 regulatory requirements and has over $570 million in CET1 capital which is far ahead of its operating targets.
.png)

FY15 Performance (Source: Company Reports)
Enhancing Bank opportunities:
Suncorp intends to leverage its A+/A1 credit ratings, solid funding and capital position capabilities to enhance its 3% mortgage market share. The group is investing to develop its channels, improve geographic penetration as well as to enhance its core franchises via ‘connected customer’ relationships. Moreover, the group’s bank NPAT improved to $354 million in FY15, as compared to $228 million in pcp driven by better net interest margin (NIM) which rose to 1.85% against 1.72% in FY14. The segment’s Bank lending enhanced to 3.9% indicating improving group’s quality as well as lower risk lending, non-performing loans and risk-weighted assets. Meanwhile, the bank’s segment lending momentum delivered a solid performance during the second half resulting to an annualized housing loan improvement of over 10% on a year over year basis. With the Project Ignite completion, SUN would be able to timely respond to changing customer needs as well as sustain market competition. Moreover, SUN’s agribusiness is also improving in view of collaborative customer approach.
.png)

Decreasing impaired and non-performing loans (Source: Company Reports)
Suncorp Life opportunities:
Suncorp’s Life business NPAT improved to $125 million during the fiscal year of 2015, as compared to $92 million in FY14. Life’s underlying profit improved to $113 million during the period, which is well ahead the group’s estimations of $90 to $100 million. Life Embedded Value improved over $1.9 billion in fiscal year of 2015 against $1.76 billion in FY14 while the value of one year’s sales doubled to $25 million. Meanwhile, SUN developed a diversified distribution with IFA, Bank. Suncorp also undertook customer base initiatives to boost its growth in highly competitive segments.
Efficient management of claims via innovation:
SUN intends to enhance its efficiencies through transformation of claims processes, ongoing rollout of the SMART motor repair network, simplification, and business intelligence efforts. The group’s SMART repaired over 127,000 cars in fiscal year of 2015 having over $400 average cost saving per car and even decreased average repair time to 11 hours as compared to 5 days. SUN estimates SMART to grow to 30 sites and add 5 SMART plus sites by fiscal year of 2016. As per the ACM Parts, the group spent over $450 million per annum on car parts with average mark-ups of 400%. The group made a JV agreement with LKQ, a US based leader in aftermarket parts and parallel imports. SUN targets to save $300 per claim in Home Repairs. In the Personal injury claims segment, SUN is stressing on fast settlement and avoiding protracted legal disputes. The segment’s reserve releases in FY15 reached $427 million (which is 5.4% of NEP), much above the long-run expectation of 1.5%.
Ongoing Suncorp Simplification and de-risking efforts:
SUN is adopting a low risk model to derive growth by maintaining its diversified funding base and A+/A1 credit ratings. Suncorp is making efforts to enhance its scenario planning and risk management capabilities to withstand the prospective downturn impacts. SUN has mainly de-risked the resolution of the non-core Bank as well as reset assumptions in the Life Insurance business. Despite incurring costs, these efforts reduced the group’s impairment losses and non-performing loans in the Bank, as well as generated a better experience in lapses and claims in the Life Insurance business. The group is enhancing models for its Advanced Accreditation process under Basel, which would lead to a better Bank’s risk management capability and overall decision making. For the Insurance business, superior risk insights have led to a better decision-making on risk selection, amount of capital required, investment mandates as well as on the level of reinsurance that needs to be bought.
.png)

Suncorp simplification and de risking efforts (Source: Company Reports)
Guidance:
Suncorp intends to improve value to its 9 million customer connections by expanding their relationships with the Group’s brands. The group intends to enhance its scale cost benefits on third party procured goods or services. Meanwhile, Suncorp estimates a sustainable returns on equity of at least 10% and anticipates an ordinary dividend payout ratio in the range of 60% to 80% of cash earnings. SUN estimates its underlying ITR to be better or around 12% through the cycle. SUN targets its NIM to be in the range of 1.75% to 1.85% driven by its price control efforts and targets a retail lending growth of 1 to 1.3 times system. Suncorp anticipates a retail deposit to loan ratio in the range of 60% to 70% driven by the Bank’s ability to leverage its ‘A+/A1’ credit ratings to raise diverse wholesale funding and improve CET1 to 12.5% to 15%. On the other hand, Suncorp’s CEO has resigned and the board is supporting Michael Cameron to replace the position. We also note that Gary Dransfield has been appointed as the CEO personal insurance who is expected to deliver greater value.
.png)

Optimized Platform (Source: Company Reports)
Stock Performance:
The group intends to continue its focus on the Australian and New Zealand markets and leverage its leading position to capture the wide range of opportunities. On the other hand, the shares of SUN corrected over 6.37% (as of October 30, 2015) in the last three months, impacted by the tough local as well as global market conditions and weak FY15 performance than expected. But, Suncorp Group delivered a total shareholder returns of 124% during the last five years ended to 30 June 2015, which is more than double as compared to the broader market return of 59% during the same period. With the Suncorp’s new Optimization program, the group would generate more $170 million of annualized benefits by the fiscal year of 2018. Management reported a positive outlook on the group, and accordingly the shares of SUN surged by over 7.55% in the last four weeks alone (as of October 30, 2015). Moreover, we believe that the group is trading at an attractive valuation with a relatively cheaper P/E of 14.8x. Suncorp also has a decent dividend yield of 5.8%. Based on the foregoing, we reiterate our BUY” recommendation to the stock at the current price of $12.95.
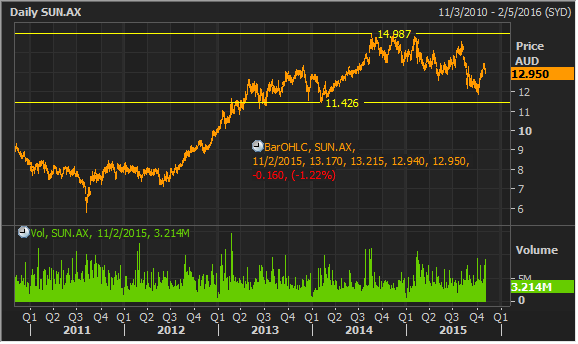
SUN Daily Chart (Source: Thomson Reuters)
Disclaimer
The advice given by Kalkine Pty Ltd and provided on this website is general information only and it does not take into account your investment objectives, financial situation or needs. You should therefore consider whether the advice is appropriate to your investment objectives, financial situation and needs before acting upon it. You should seek advice from a financial adviser, stockbroker or other professional (including taxation and legal advice) as necessary before acting on any advice. Not all investments are appropriate for all people.Kalkine.com.au and associated pages are published by Kalkine Pty Ltd ABN 34 154 808 312 (Australian Financial Services License Number 425376).The information on this website has been prepared from a wide variety of sources, which Kalkine Pty Ltd, to the best of its knowledge and belief, considers accurate. You should make your own enquiries about any investments and we strongly suggest you seek advice before acting upon any recommendation.Kalkine Pty Ltd has made every effort to ensure the reliability of information contained in its newsletters and websites. All information represents our views at the date of publication and may change without notice. To the extent permitted by law, Kalkine Pty Ltd excludes all liability for any loss or damage arising from the use of this website and any information published (including any indirect or consequential loss, any data loss or data corruption). If the law prohibits this exclusion, Kalkine Pty Ltd hereby limits its liability, to the extent permitted by law to the resupply of services. There may be a product disclosure statement or other offer document for the securities and financial products we write about in Kalkine Reports. You should obtain a copy of the product disclosure statement or offer document before making any decision about whether to acquire the security or product.The link to our Terms & Conditions has been provided please go through them and also have a read of the Financial Services Guide. On the date of publishing this report (mentioned on the website), employees and/or associates of Kalkine Pty Ltd currently hold positions in: BHP, BKY, KCN, PDN, and RIO. These stocks can change any time and readers of the reports should not consider these stocks as advice or recommendations.
Copyright
Copyright © 2014 Kalkine Pty Ltd ABN 34 154 808 312. No part of this website, or its content, may be reproduced in any form without the prior consent of Kalkine Pty Ltd.
Kalkine is a trading name of Kalkine Pty Ltd ABN 34 154 808 312, which holds Australian Financial Services Licence No. 425376.
Past performance is not a reliable indicator of future performance.

 Please wait processing your request...