
Kalkine’s Global Tariff Report provides fully independent analysis and data-driven analysis of major global sectors affected by tariff changes, evaluating the implications these shifts may have on equity valuations across those industries. The report concentrates on trade-sensitive sectors that typically experience heightened investor scrutiny during periods of tariff uncertainty. It also identifies defensive and countercyclical segments that demonstrate relative resilience or may even outperform, amid disruptions to global trade flows.
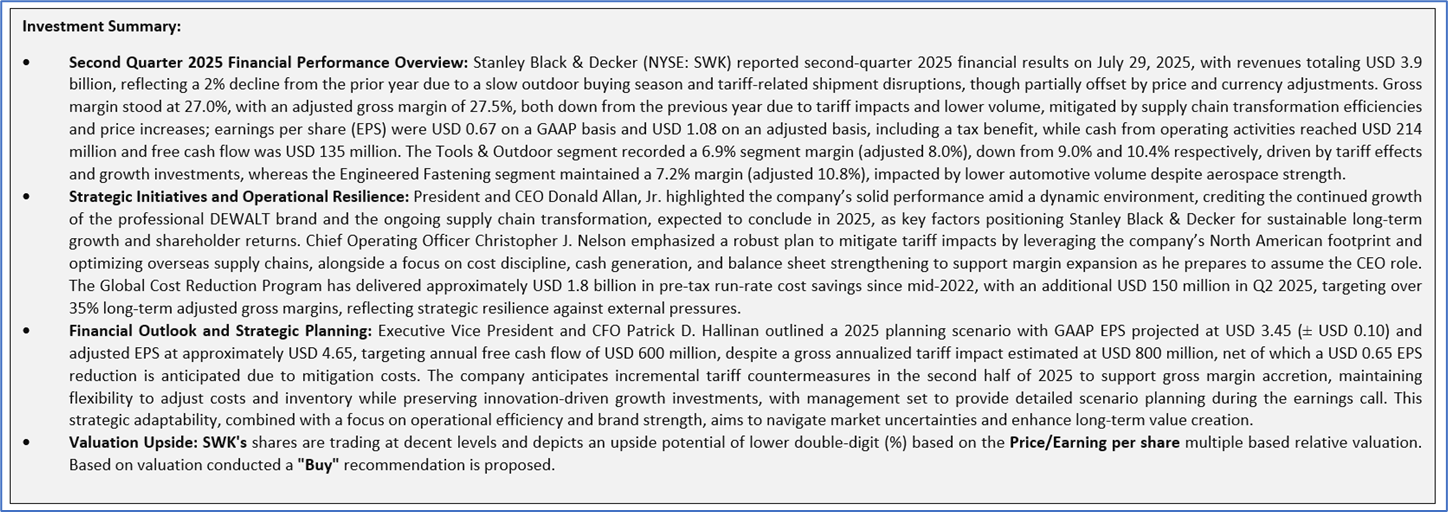
As illustrated in the table below, several key sectors in different countries are directly impacted by the recent tariff announcement from President Trump.
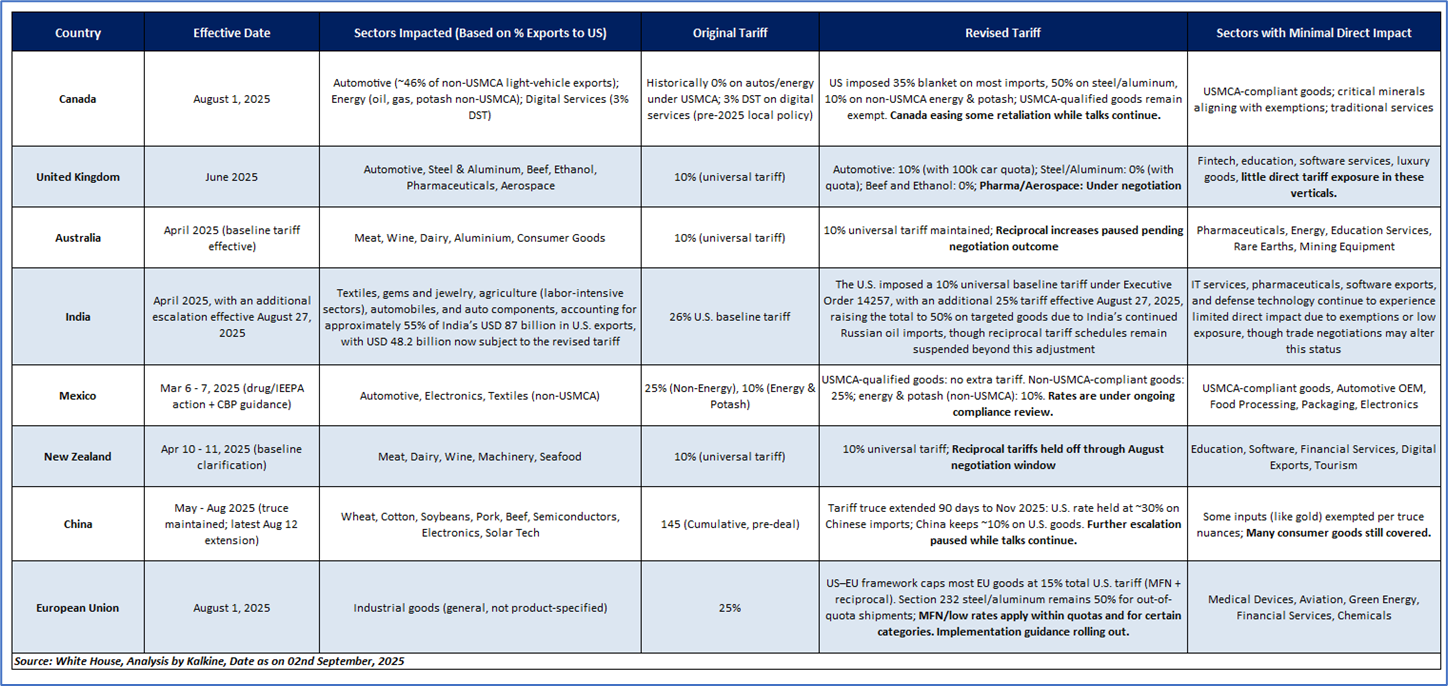
Latest Updates on Global Tariffs by Trump’s Administration
Key Developments (as of September 02nd, 2025)
Canada
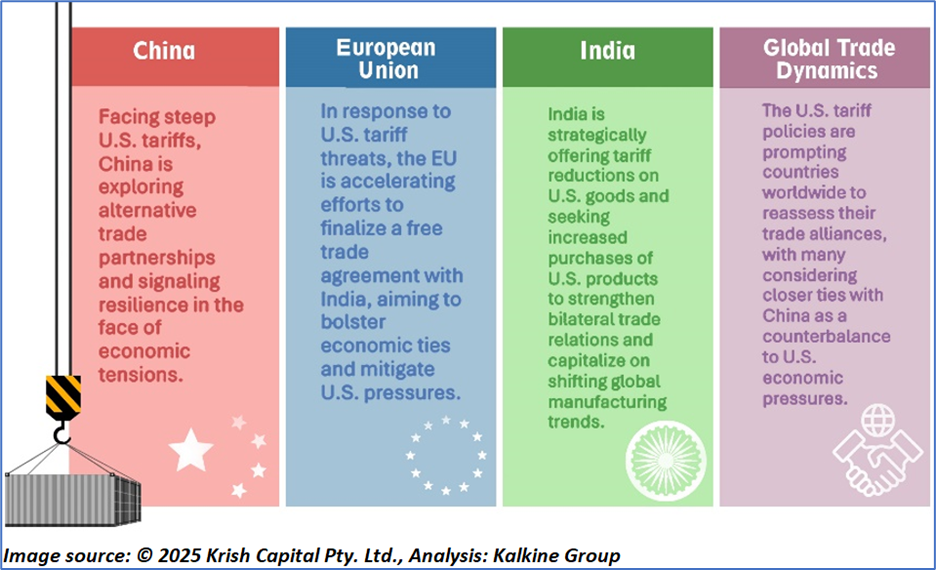
India
China
European Union
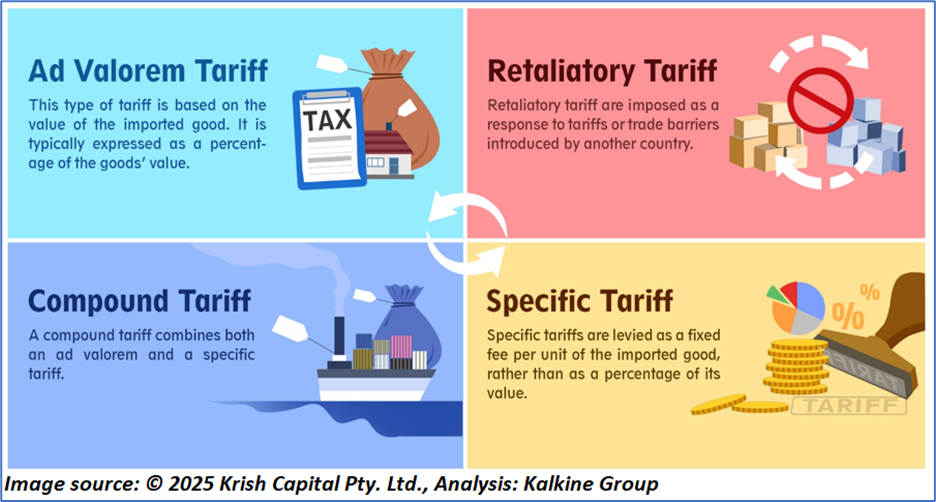
What are the different types of Tariffs?
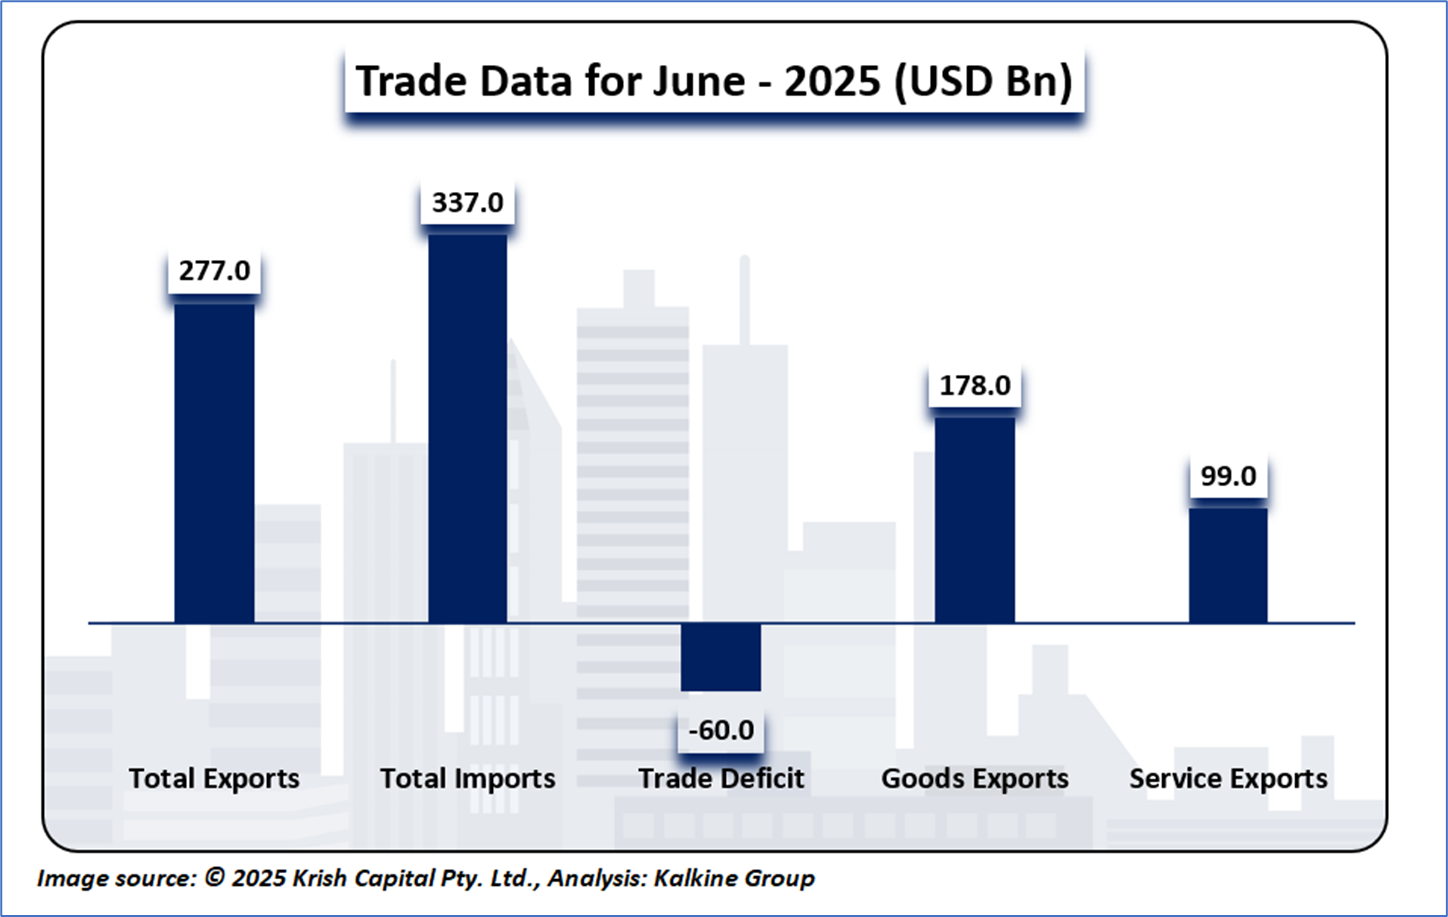
A Snapshot of USA’s Trade Size
In June 2025, the United States recorded total exports valued at USD 277.0 billion, comprising USD 178.0 billion in goods exports and USD 99.0 billion in service exports, while total imports reached USD 337.0 billion, resulting in a trade deficit of USD 60.0 billion, consistent with recent trends of import-heavy trade dynamics. The modest growth in service exports, which constitute approximately 35.7% of total exports, reflects a resilient digital and financial services sector, potentially bolstered by domestic innovation and global demand, though this was insufficient to offset the 52.8% dominance of goods imports. This imbalance underscores ongoing challenges in manufacturing competitiveness and reliance on foreign goods, suggesting that while service-led growth provides a buffer, strategic measures to enhance goods export capacity or mitigate import costs—such as tariff adjustments—may be critical to narrowing the deficit in the medium term.
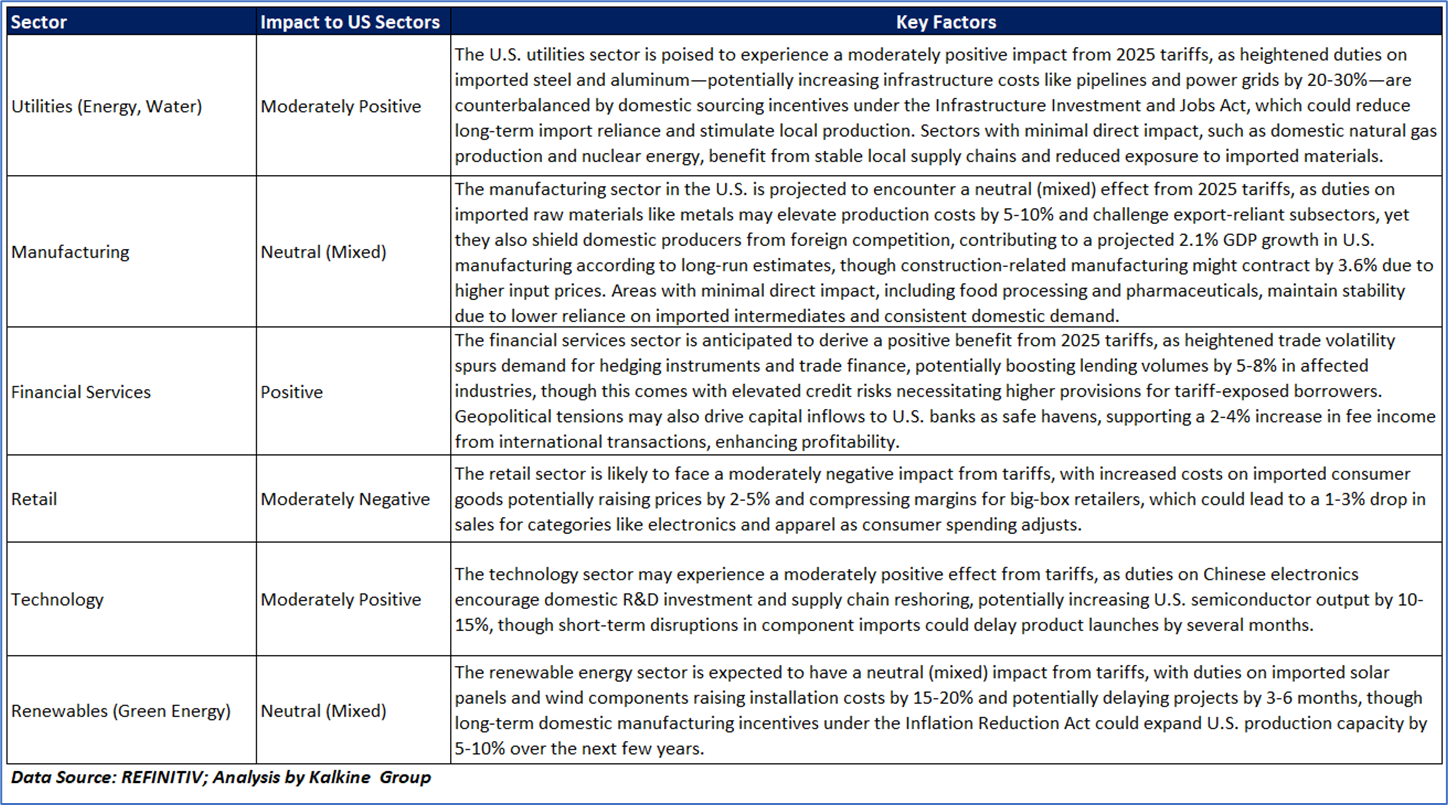
Impact of US Tariffs on Various Sectors
The U.S. economy is currently grappling with significant challenges, including high inflation, supply chain disruptions, and the effects of aggressive monetary policy from the Federal Reserve. Key sectors such as manufacturing, agriculture, and technology are feeling strain, particularly due to their dependence on global supply chains and export markets, with trade policies like tariffs on steel, aluminum, and electronics driving up costs for businesses and consumers alike. Despite these pressures, there’s cautious optimism in some quarters about market stabilization within the next year, though this is tempered by ongoing issues like labor shortages, energy price volatility, and political divisions. The Federal Reserve’s interest rate hikes aimed at curbing inflation—still above target levels—have slowed economic growth, raising recession risks, while strategic efforts such as trade agreements and supply chain diversification remain critical to fostering stability and mitigating prolonged uncertainty across these vital sectors.
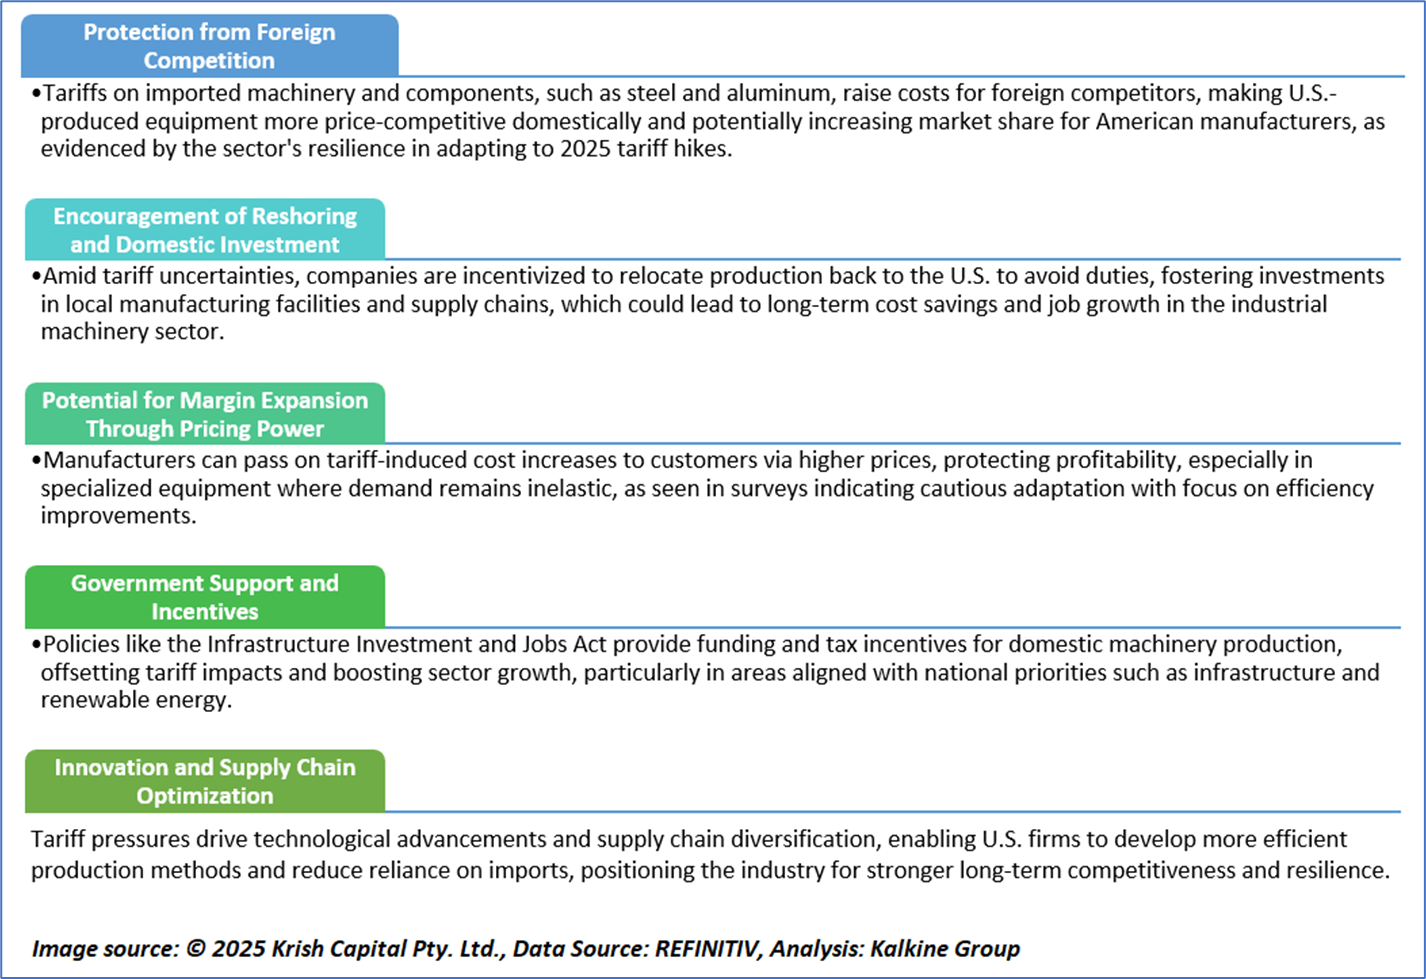
Why does the US Industrial Machinery & Equipment Industry look Attractive Amid Tariff Concerns?
Amid elevated Market Volatility and Tariff pressures, Stanley Black & Decker Inc (NYSE: SWK) stands out as our defensive pick within the Industrial Machinery Industry, supported by rigorous fundamental and technical research
Kalkine’s Global Tariff Report covers the Investment Highlights, Key Financial Metrics, Risks, Technical Analysis along with the Valuation, Target Price, and Recommendation on Stanley Black & Decker Inc (SWK).
Section 1: Company Overview and Fundamental Insights
1.1 Company Overview:
Stanley Black & Decker, Inc. (NYSE: SWK) engages in the provision of power and hand tools, and related accessories, products, services and equipment for oil and gas, infrastructure applications, commercial electronic security and monitoring systems, healthcare solutions, and mechanical access solutions. It operates through the Tools and Outdoor and Industrial segments.
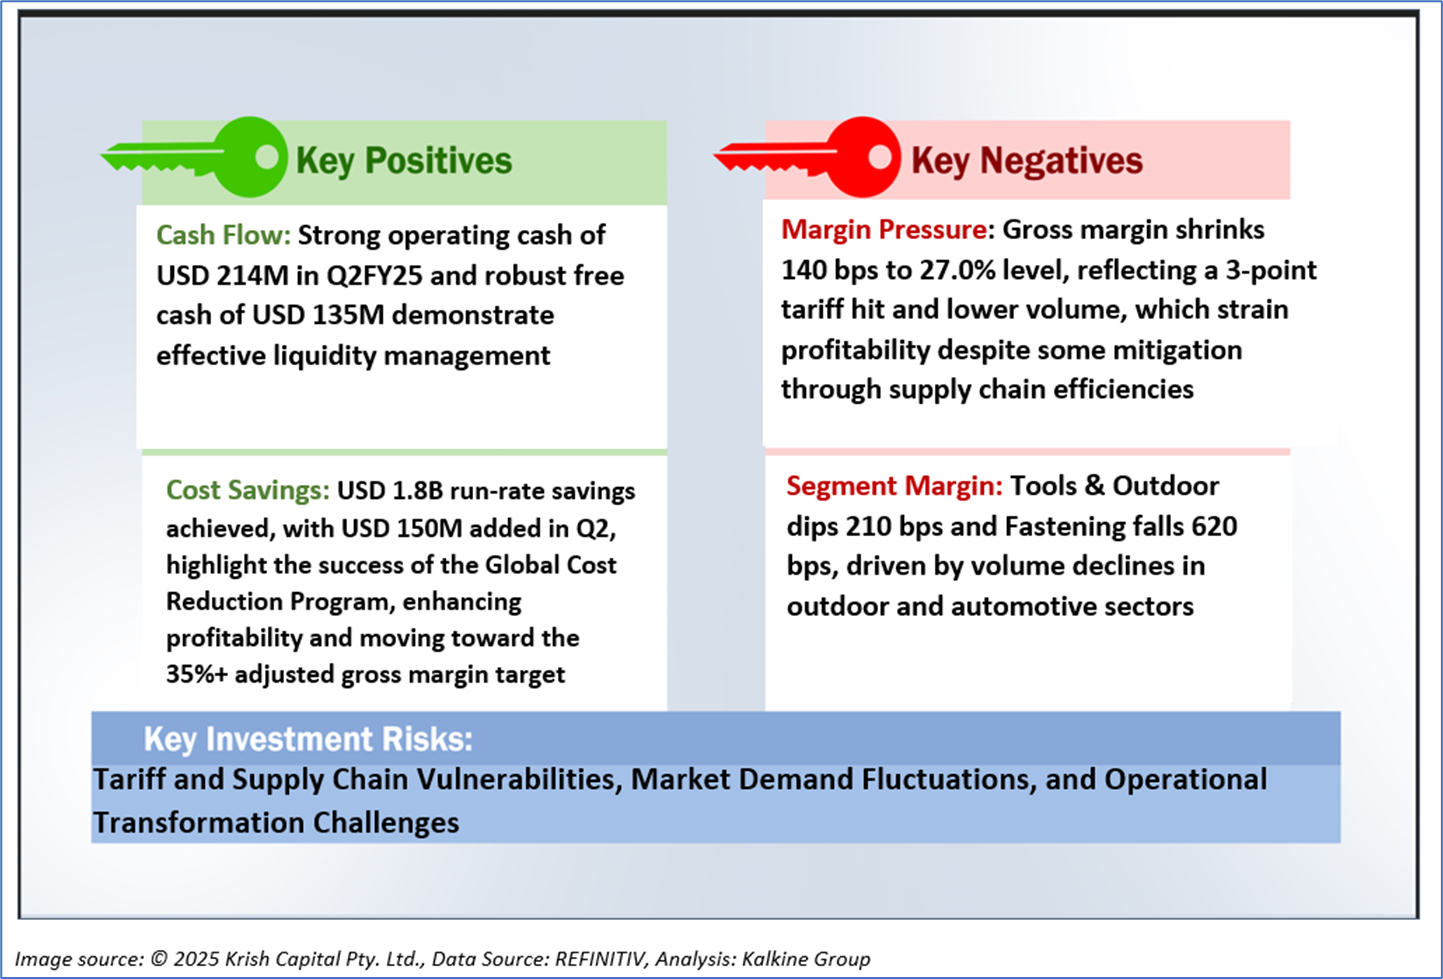
1.2 The Key Positives, Negatives, Investment Highlights and Risks
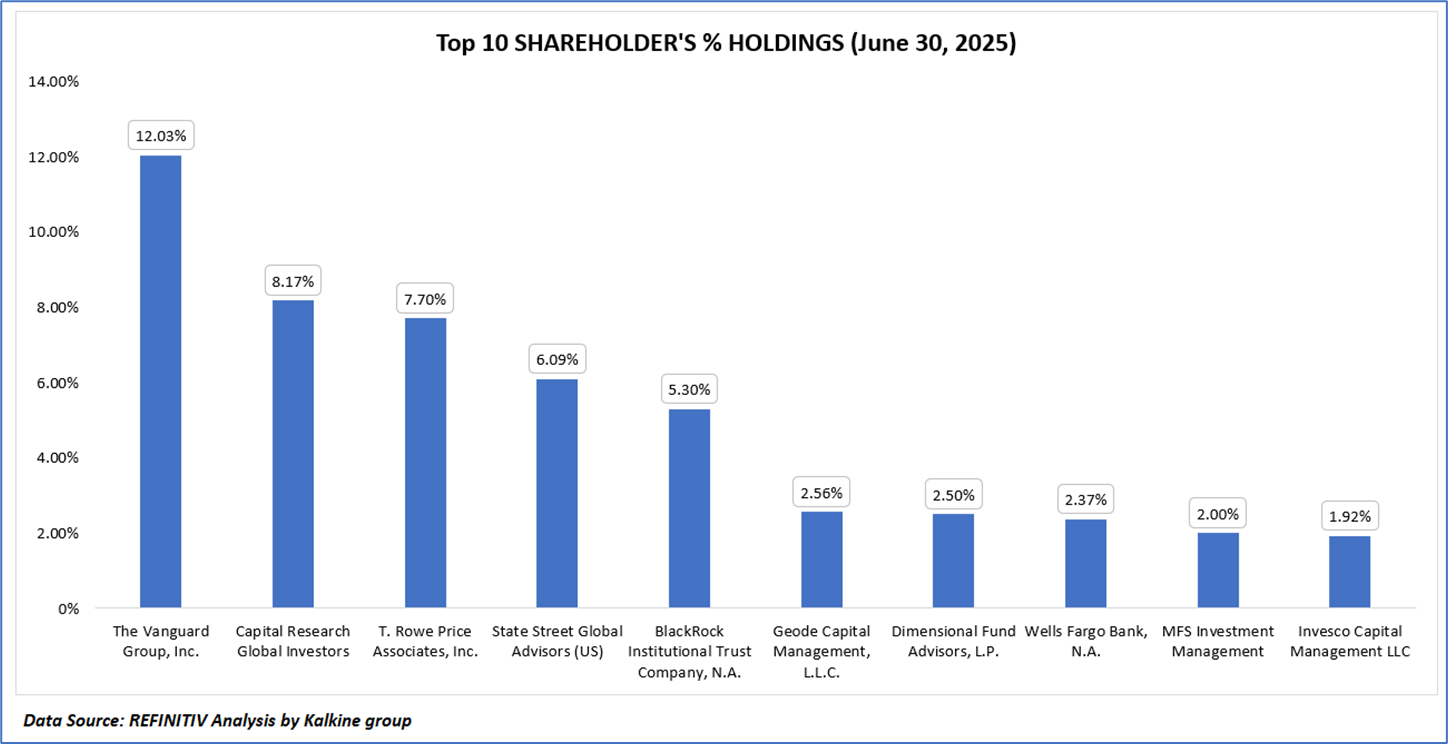
1.3 Top 10 Shareholders:
The top 10 shareholders together form ~50.65% of the total shareholding, indicating concentrated holding. The Vanguard Group, Inc. and Capital Research Global Investors hold a maximum stake in the company at ~12.03% and ~8.17%, respectively.
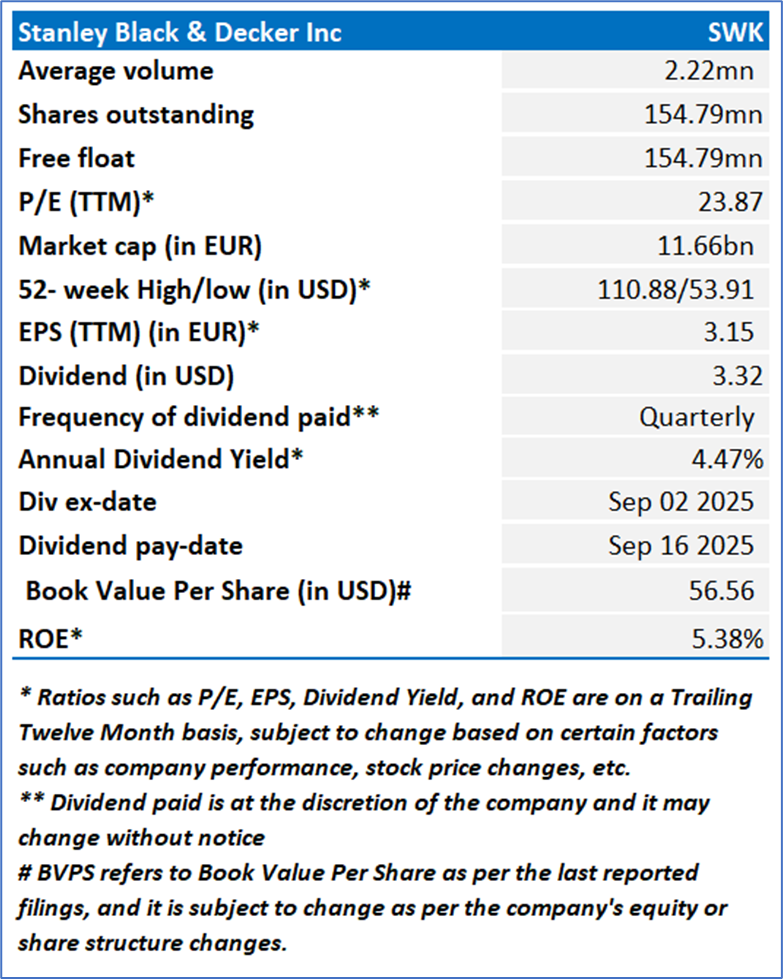
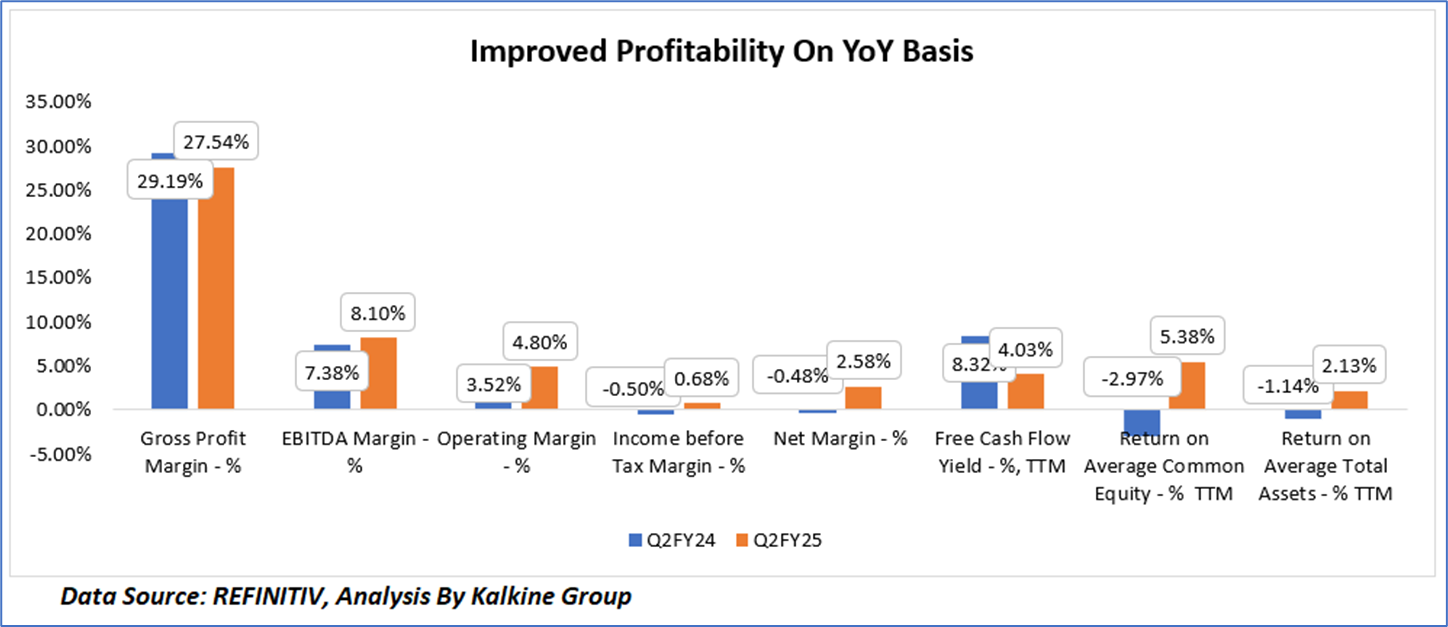
1.4 Key Metrics:
Stanley Black & Decker (NYSE: SWK) exhibited a mixed financial performance in the second quarter of fiscal 2025 compared to the same period in 2024, with gross profit margin contracting from 29.19% to 27.54% due to a 3-point tariff impact and lower volumes, though mitigated by supply chain efficiencies, while EBITDA margin improved from 7.38% to 8.10% and operating margin rose from 3.52% to 4.80%, reflecting effective cost discipline and pricing adjustments. Income before tax margin turned positive to 0.68% from a negative 0.50%, and net margin surged from -0.48% to 2.58%, driven by a favorable tax settlement and operational improvements, indicating a recovery in profitability despite external pressures. However, trailing twelve-month (TTM) free cash flow yield declined from 8.32% to 4.03% and return metrics improved significantly with return on average common equity rising from -2.97% to 5.38% and return on average total assets increasing from -1.14% to 2.13%, suggesting enhanced capital efficiency but potential liquidity constraints, necessitating cautious optimism as the company navigates tariff challenges and pursues long-term margin expansion.
Section 2: Business Updates and Financial Highlights
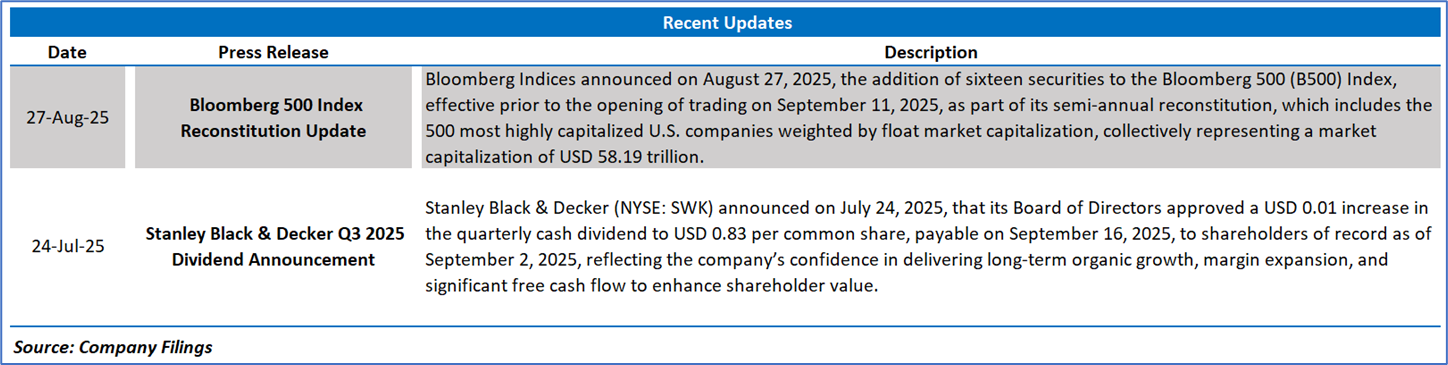
2.1 Recent Updates: The below picture gives an overview of the company’s recent activities, such as an announcement regarding dividend distribution.
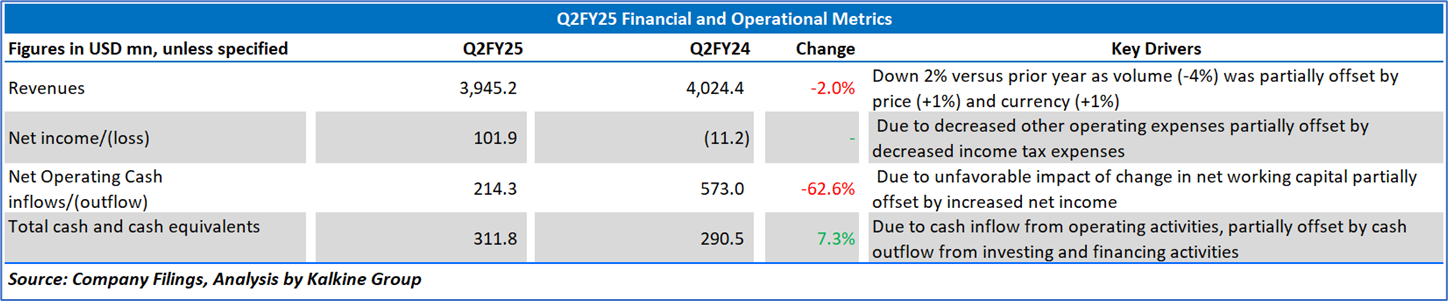
2.2 Insights into Q2FY25 Financial Performance:
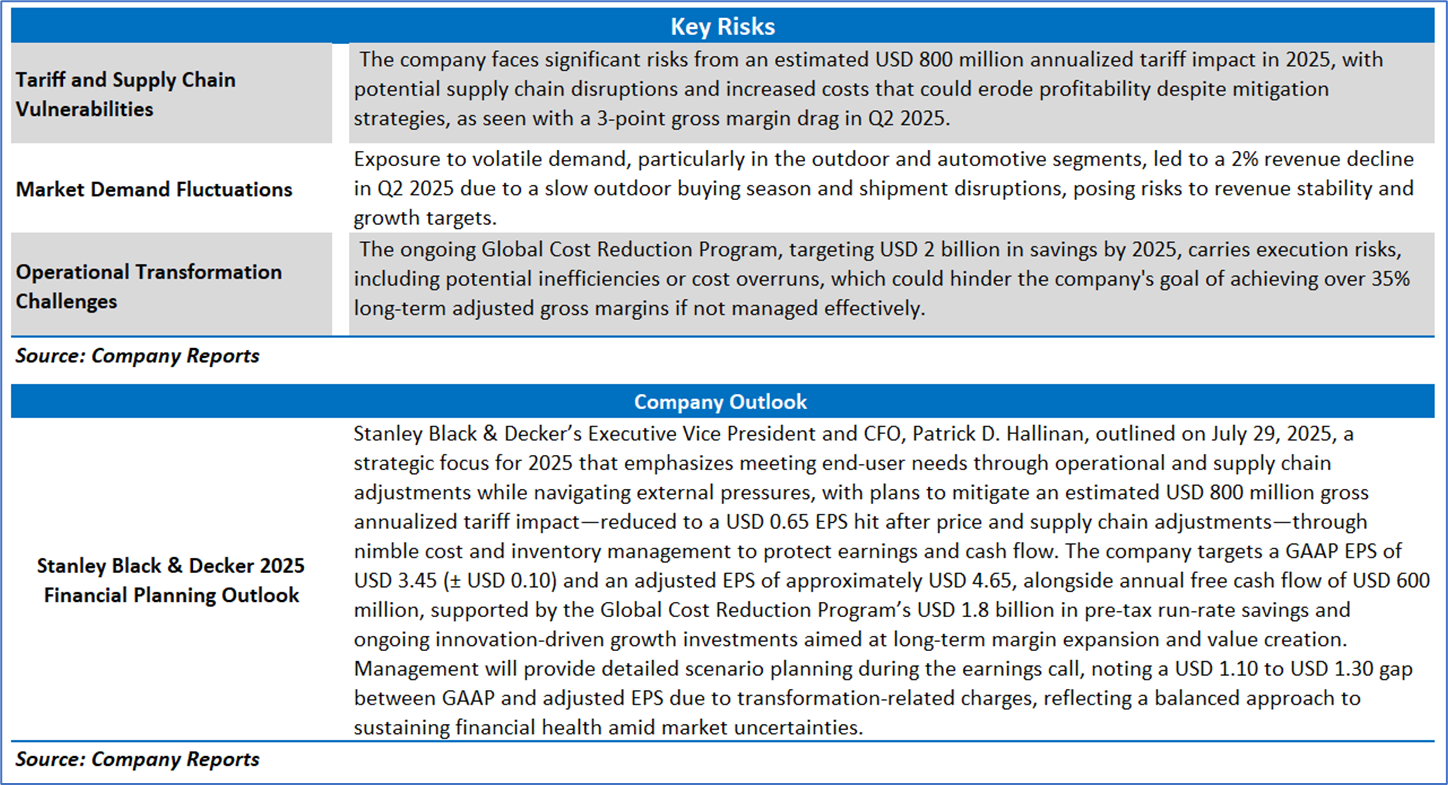
Section 3: Key Risks, Company Outlook:
Section 4: Stock Recommendation Summary:
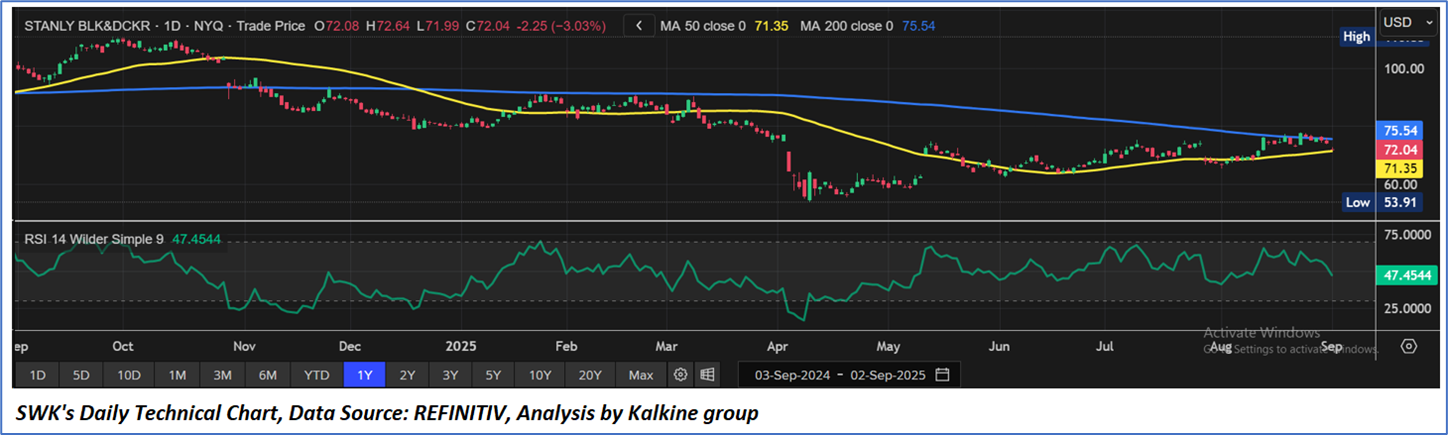
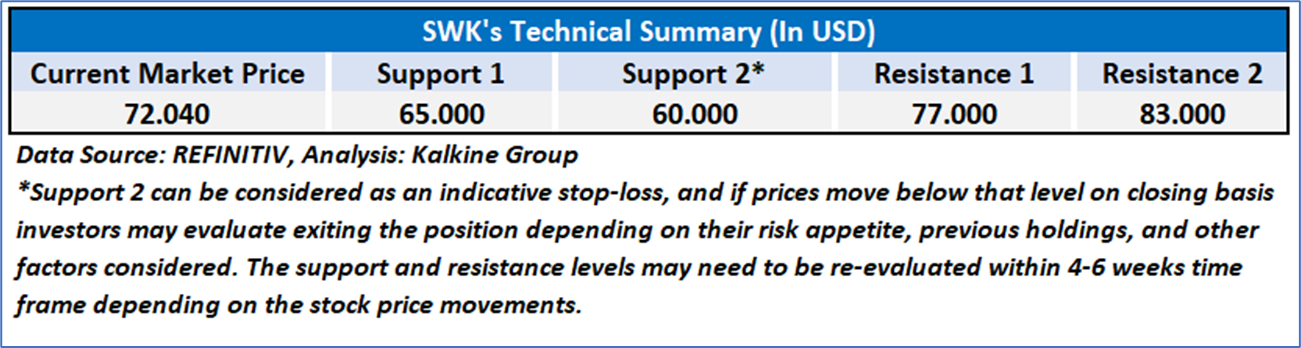
4.1 Price Performance and Technical Summary:
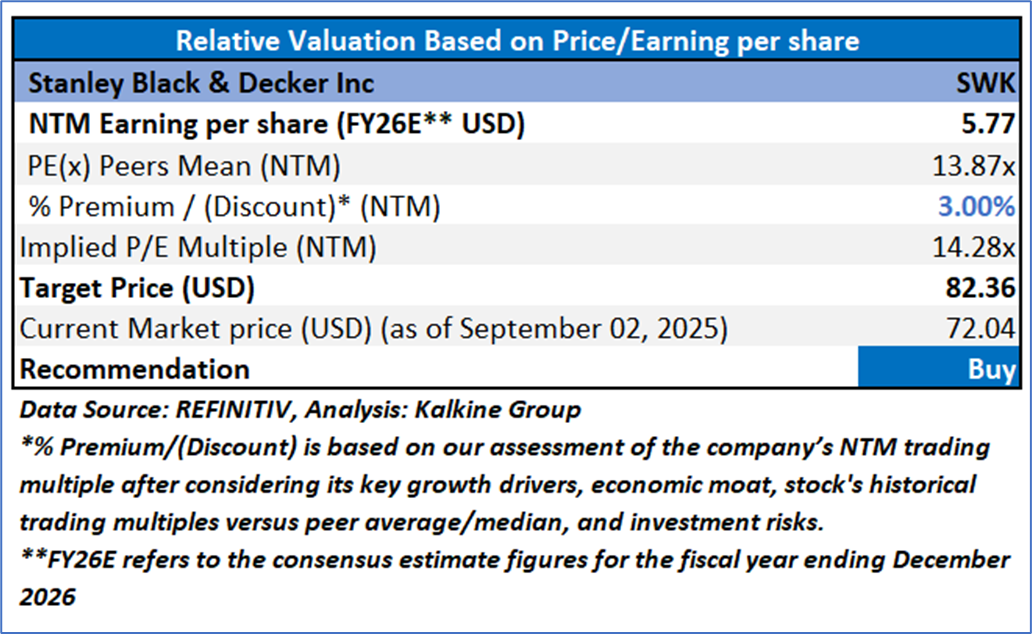
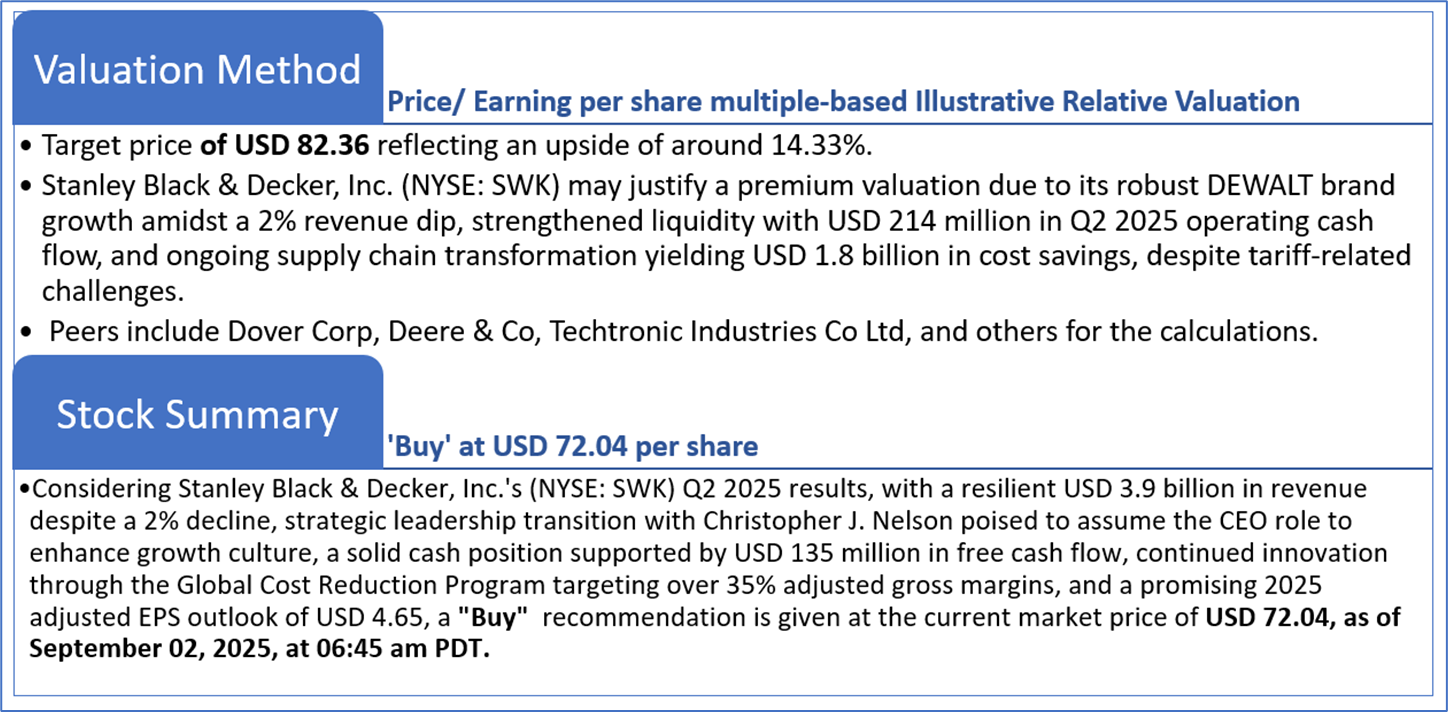
4.2 Fundamental Valuation
Valuation Methodology: Price/ Earnings Per Share Multiple Based Relative Valuation (Illustrative)
Note 1: Past performance is not a reliable indicator of future performance.
Note 2: The reference date for all price data, currency, technical indicators, support, and resistance levels as on September 02, 2025. The reference data in this report has been partly sourced from REFINITIV.
Note 3: Investment decisions should be made depending on an individual's appetite for upside potential, risks, holding duration, and any previous holdings. An 'Exit' from the stock can be considered if the Target Price mentioned as per the Valuation and or the technical levels provided has been achieved and is subject to the factors discussed above.
Note 4: Dividend Yield may vary as per the stock price movement.
Note 5: Kalkine reports are prepared based on the stock prices captured either from REFINITIV or Trading View. Typically, REFINITIV or Trading View may reflect stock prices with a delay which could be a lag of 25-30 minutes. There can be no assurance that future results or events will be consistent with the information provided in the report. The information is subject to change without any prior notice.
Technical Indicators Defined: -
Support: A level at which the stock prices tend to find support if they are falling, and a downtrend may take a pause backed by demand or buying interest.
Resistance: A level at which the stock prices tend to find resistance when they are rising, and the uptrend may take a pause due to profit booking or selling interest.
Stop-loss: In general, it is a level to protect further losses in case of any unfavorable movement in the stock prices.
This report (“Report”) has been issued by Kalkine Pty Limited (ABN 34 154 808 312) (Australian financial services licence number 425376) (“Kalkine”) and prepared by Kalkine and its related bodies corporate who are authorised to provide general financial product advice. Kalkine.com.au and its associated pages are published by Kalkine.
Any advice provided in this Report is general advice only and does not take into account your objectives, financial situation or needs. You should therefore consider whether the advice is appropriate for your objectives, financial situation and needs before acting upon it.
There may be a Product Disclosure Statement, Information Memorandum or other offer document (“Offer Document”) for the securities or other financial products referred in this Report. You should obtain a copy of the relevant Offer Document and consider it before making any decision about whether to acquire the security or financial product.
Kalkine strongly recommends that you seek advice from a financial adviser, stockbroker or other professional (including taxation and legal advice) before acting on any of the general advice in this Report or on the Kalkine website. Not all investments are appropriate for all people.
The information in this Report and on the Kalkine website has been prepared from a wide variety of sources, which Kalkine, to the best of its knowledge and belief, considers accurate. Kalkine has made every effort to ensure the reliability of the information contained in its reports (including this Report), newsletters and websites. All information represents our views at the date of publication and may change without notice.
The information in this Report does not constitute an offer to sell securities or other financial products or a solicitation of an offer to buy securities or other financial products. Our reports contain general recommendations to invest in securities and other financial products. Kalkine is not responsible for, and does not guarantee, the performance of, or returns on, any investments mentioned in this Report.
Kalkine does not issue, sell or deal in any financial products.
This Report may contain information on past performance of particular investments. Past performance is not a reliable indicator of future performance. Returns stated do not take into account transaction costs and taxes. To the extent permitted by law, and excluding any dishonesty or gross negligence by Kalkine, Kalkine disclaims and excludes all liability for any direct, indirect, implied, punitive, special, incidental or other consequential loss or damage arising from the use of or reliance on this Report, the Kalkine website and any information published on the Kalkine website without any warranties or representations by Kalkine to you. To the extent the law prohibits or limits this exclusion, Kalkine limits its liability to the resupply of services.
Please also read our Terms & Conditions and Financial Services Guide for further information. Employees and/or associates of Kalkine and its related entities may hold interests in the securities or other financial products covered in this Report or on the Kalkine website. Any such employees and associates are required to comply with certain, procedures and disclosures as required by law.
Kalkine Media Pty Ltd, an affiliate of Kalkine Pty Ltd, may have received, or be entitled to receive, financial consideration in connection with providing information about certain entity(s) covered on its website including entities covered in this Report.
Copyright 2025 Krish Capital Pty. Ltd. (ABN 61629651510). All Rights Reserved. No part of this report, or its content, may be reproduced in any form without our prior consent.
Past performance is not a reliable indicator of future performance.
 Please wait processing your request...